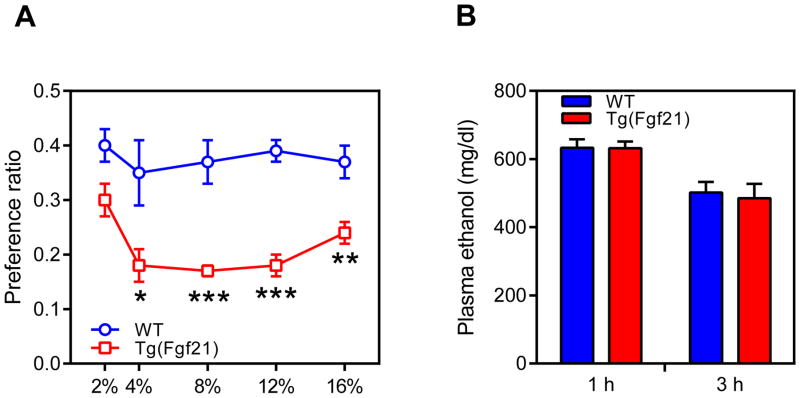
Figure 4. FGF21 decreases alcohol preference.
(A) Ethanol preference ratio in wild-type (WT) and Tg(Fgf21) mice at the indicated ethanol concentrations (n = 9/group).
(B) Plasma ethanol concentrations in groups of WT and Tg(Fgf21) mice 1 or 3 hours after i.p. injection of ethanol (4g/kg) (n = 4–5/group).
Values are means ±S.E.M. *, p<0.05; **, p<0.01; and ***, p<0.001 versus control group by Student’s t-test.
See also Table S3.

