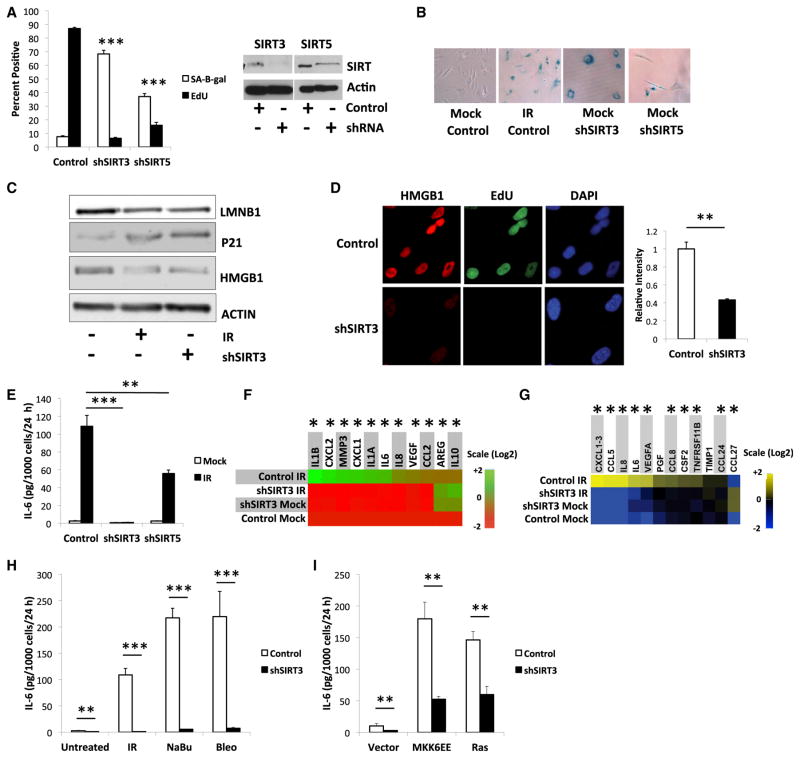
Figure 1. Loss of Mitochondrial SIRTs Induce Senescence.
(A) (Left) SA-Bgal and BrdU indices 10 days after IMR-90 cells were infected with control (scrambled sequence), shSIRT3-, or shSIRT5-expressing lentiviruses. (Right) SIRT3, SIRT5, and actin (control) protein levels after infection.
(B) Representative image of cells 10 days after senescence induction by shSIRT3, shSIRT5, and/or 10 Gy IR, stained for SA-Bgal.
(C) Intracellular LMNB1, p21, and HMGB1 protein levels 10 days after IR or infection with control (−) or shSIRT3 (+) lentiviruses.
(D) (Left) Representative image of EdU and HMGB1 staining in control and shSIRT3-expressing cells. (Right) Quantification of nuclear HMGB1 staining intensity.
(E) IL-6, measured by ELISA, in conditioned media from control, shSIRT3-, or shSIRT5-expressing cells 10 days after mock irradiation or 10 Gy IR.
(F) Heatmap of the indicated mRNA levels detected by qPCR in non-senescent (mock) or senescent (IR) cells infected with control or shSIRT3 lentiviruses, normalized to mock cells.
(G) Heatmap of secreted protein levels by above cells, detected by antibody array.
(H and I) Secreted IL-6 levels in response to senescence inducers, normalized to control shRNA cells: IR, NaBu, Bleo, and expression of constitutively active MKK6 (MKK6EE) or oncogenic RAS. Bar graphs indicate mean + SEM.

