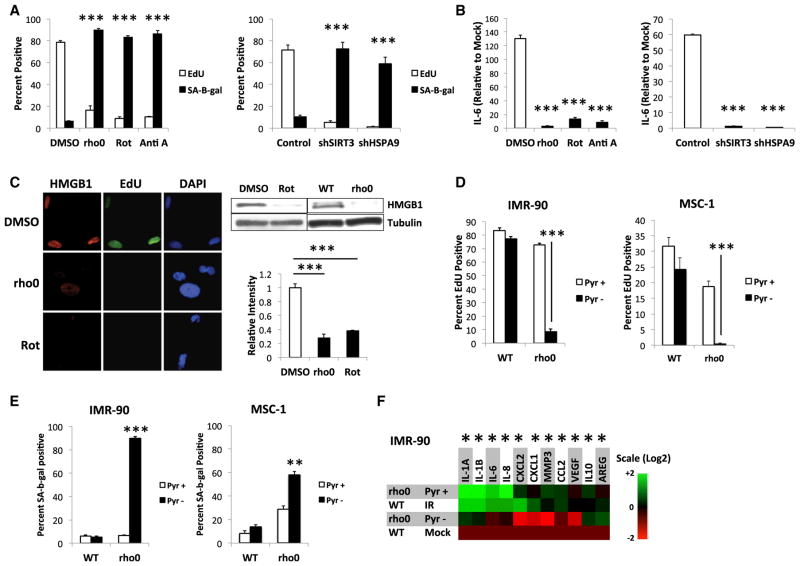
Figure 2. Mitochondrial Dysfunction-Induced Senescence.
(A) (Left) IMR-90 cells were cultured in DMSO (control), ethidium bromide (rho0), rotenone (Rot), or antimycin A (Anti A) or (right) infected with control, shSIRT3-, or shHSPA9-expressing lentiviruses and analyzed for SA-Bgal and EdU 10 days later.
(B) Cells from (A) were mock irradiated or irradiated (10 Gy) and analyzed for IL-6 mRNA by qPCR.
(C) Cells cultured in control DMSO, EtBr (rho0), or rotenone (Rot) for 14 days were analyzed for EdU incorporation and nuclear HMGB1 by immunofluorescence and cellular HMGB1 by immunoblotting.
(D) Rho0 IMR-90 (left) or MSC-1 (right) were generated in the presence of pyruvate and uridine. WT and rho0 cells cultured with (Pyr+) or without (Pyr−) pyruvate for 7 days were analyzed for EdU incorporation.
(E) SA-Bgal activity in cells from (D).
(F) WT cells were mock or irradiated to senesce by IR (IR) and compared to rho0 cells cultured + or −pyruvate. Indicated mRNA levels were determined by qPCR. Bar graphs indicate mean + SEM.

