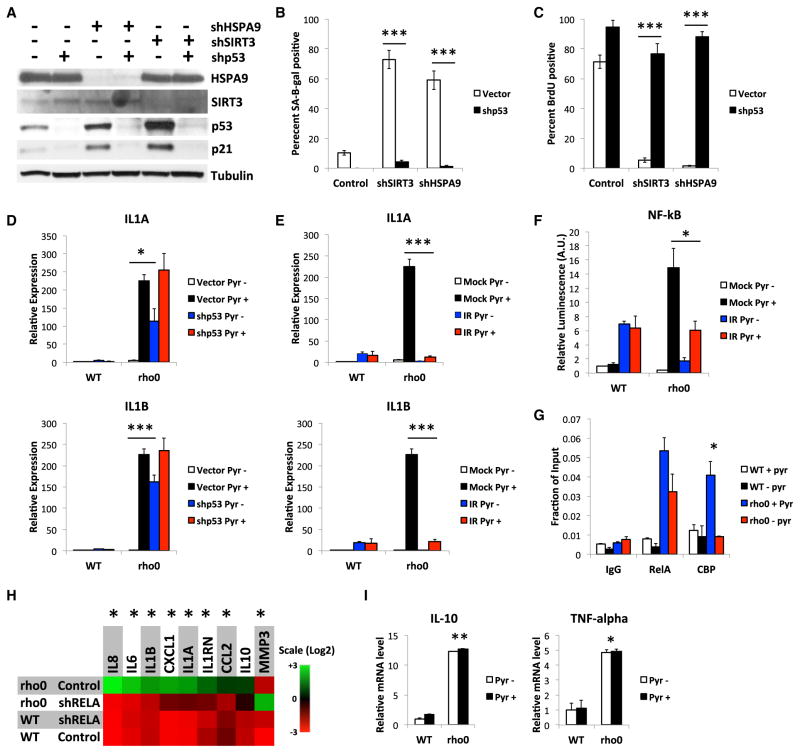
Figure 5. p53 Suppresses SASP Factors in MiDAS.
(A–C) Cells were infected with lentiviruses expressing control, SIRT3 or HSPA9 shRNAs, then a p53 shRNA (shp53) or control virus, were assayed 10 days later for HSPA9, SIRT3, p53 and p21 protein (A), SA-Bgal activity (B), and BrdU incorporation (C).
(D) RNA from WT and rho0 cells, infected with shp53 or control lentiviruses and cultured + or − pyruvate for 10 days was analyzed for IL-1A (upper panel) and IL-1B (lower panel) mRNA by qPCR.
(E) RNA from WT or rho0 cells, mock- or IR-treated, and cultured + or − pyruvate for 10 days was analyzed as in (D).
(F) NF-κB reporter activity in cells cultured as in (E).
(G) ChIP assays for RelA and CBP binding at the IL1A promoter in WT and rho0 cells cultured + or − pyruvate for 7 days.
(H) WT and rho0 cells were cultured + or − pyruvate and infected with control or shRelA-expressing lentiviruses, and mRNA levels were measured by qPCR.
(I) WT and rho0 cells cultured + or − pyruvate were analyzed for IL-10 and TNF-α mRNAs by qPCR. Bar graphs indicate mean + SEM.

