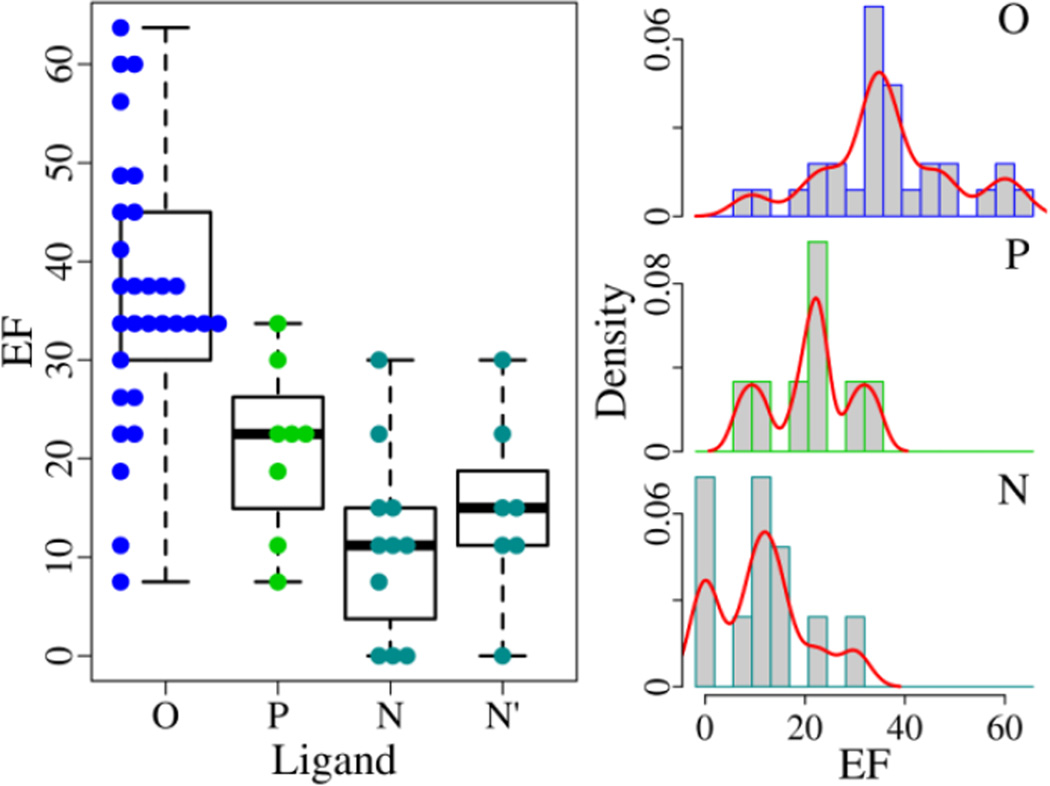
Fig. 2.
Discerning ability of EGFR structures bound with different ligands in virtual screening. For the ensembles (O, P, N and N'), the EF varies from 7.5, 7.5, 0, and 0 to 63.7, 33.7, 30.0, and 30.0, respectively. The best EF (63.7) is achieved with a structure bound with an organic compound. The density curve is plotted in red.

