
Fig. 2.
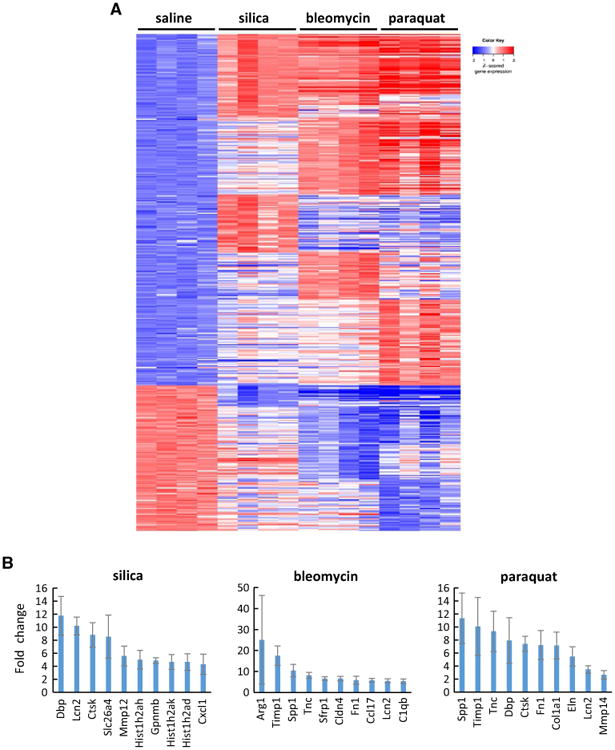
Differential gene expression revealed by microarray. Genome-wide gene transcription profiling was obtained by microarray gene expression analysis on RNA samples isolated from the lungs exposed to fibrogenic agents for 7 days (n = 4 for each group). The genes possessing p value with FDR ≤ 0.05, and the either up-regulated or down-regulated fold change, compared with saline-treated control group, more than 2.0 following silica, bleomycin, or paraquat exposure, were identified and studied. A A heat map was generated for the differentially expressed genes. In the heat map, up-regulated genes were arranged in the upper part, and down-regulated genes in the lower part. Within each of these two parts, the common genes affected by all three agents, i.e., silica, bleomycin, and paraquat, were listed first; the common genes affected by any two agents, i.e., silica and bleomycin, or silica and paraquat, or bleomycin and paraquat, were listed secondly; and the unique genes that were only affected by one agent, i.e., silica, bleomycin, or paraquat, were listed last. Red, white, and blue indicate high, medium, and low expression levels, respectively. B Examples of up-regulated genes for each treatment group were shown with fold changes (mean ± SD, n = 4)