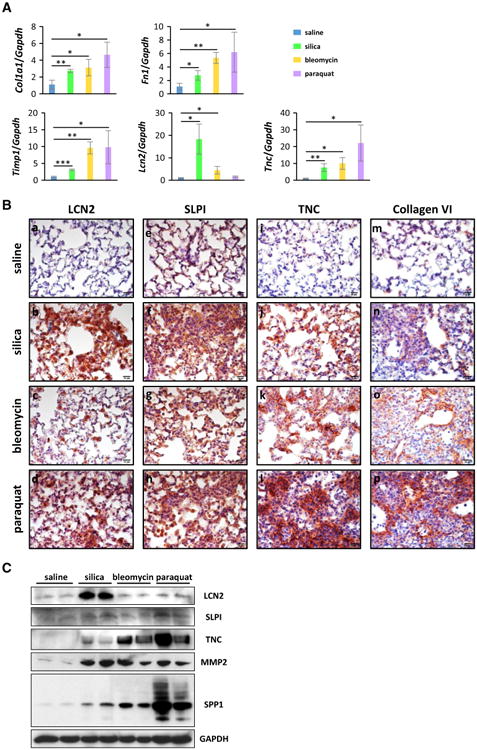
Fig. 4.

Induction of gene expression in fibrotic lung tissues. A Quantitative RT-PCR analysis was performed and fold changes of mRNA levels relative to that of Gapdh were presented as mean ± SD (n = 3 for each group; *p < 0.05; **p < 0.01, ***p < 0.001). B Levels of LCN2 (a–d), SLPI (e–h), TNC (i–l), and collagen VI (m–p) were determined on lung sections by immunohistochemistry (red, scale bar 20 μm). Blue indicates nuclear staining. C The levels of LCN2, SLPI, TNC, MMP2, and SPP1 in lung tissues were determined by immunoblotting; blotting results for two randomly selected samples from each group were presented as illustration. GAPDH was used as an internal control
