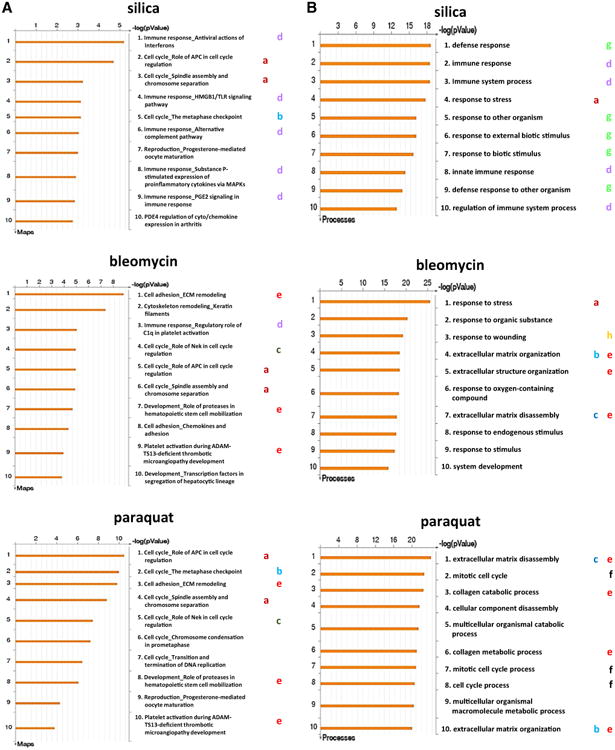
Fig. 5.

Comparison of signaling pathways and cellular processes activated by fibrogenic inducers. A Identification and comparison of activated canonical pathways. The top ten statistically significant pathways enriched by the exposure to each fibrogenic agent were presented. Shared and unique pathways activated by the agents were labeled with letters in colors as described under “Results”. B gene ontology (GO) enrichment analysis disclosed promoted cellular processes. The top ten statistically significant processes enhanced by each fibrogenic agent were presented. Shared and unique processes were marked with letters in colors as described under “Results”
