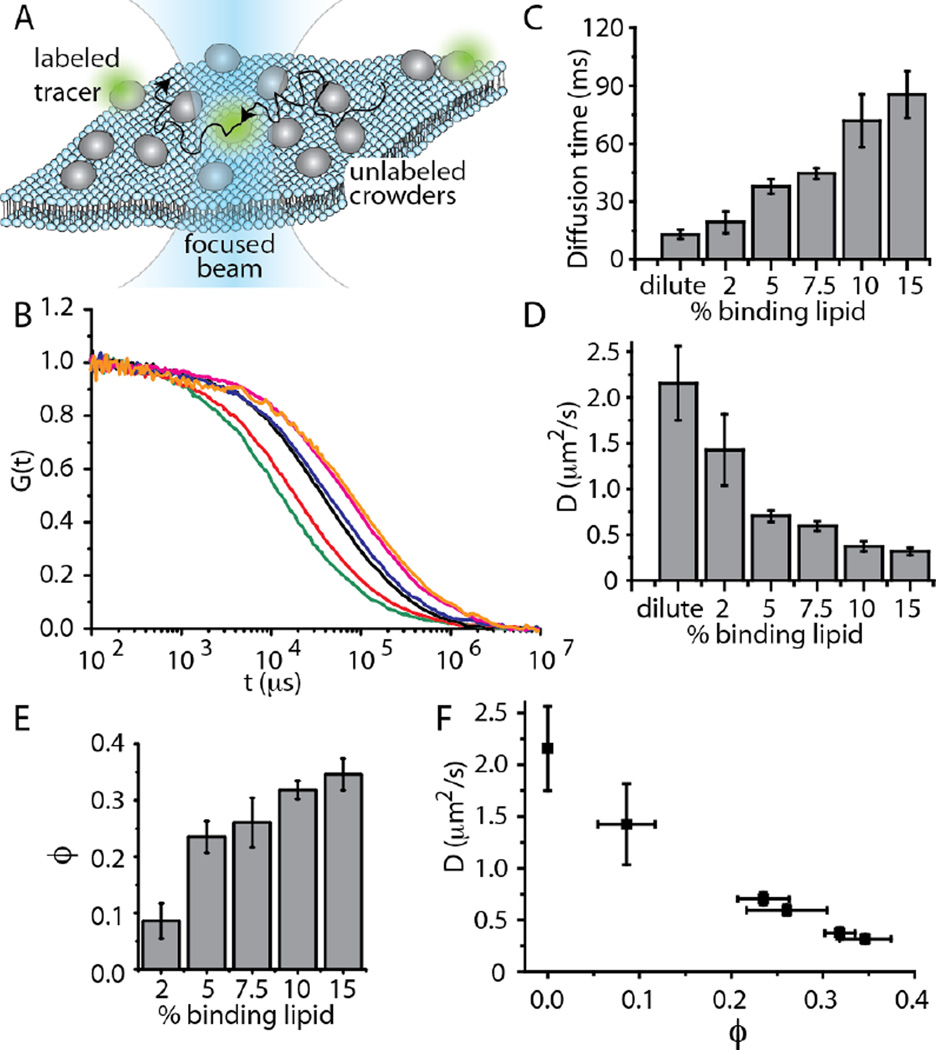
Figure 1.
Diffusivity decreases linearly with increasing membrane coverage by transferrin. (A) Fluorescence correlation spectroscopy (FCS) measurement scheme. Peripheral membrane-bound proteins diffuse freely over the surfaces of supported lipid bilayers. The diffusivity of a small population of labeled tracer proteins is measured by autocorrelating fluctuations in the intensity of fluorescence emission as they diffuse through a laser beam focused at the membrane surface. (B) Autocorrelation curves for increasing concentration of Ni-NTA lipids, which serve as protein binding sites: dilute (green), 2 mol% NTA (red), 5 mol% NTA (black), 7.5 mol% NTA (blue), 10 mol% NTA (pink), 15 mol% NTA (orange). (C) As binding site density increased, diffusive time constant increased, (D) diffusivity decreased, and (E) protein coverage increased. (F) Diffusivity decreased approximately linearly with increasing membrane coverage. The detailed procedure used to measure membrane coverage is described in the Experimental section. In all plots, error bars represent the standard deviation of multiple trials. The number of trials for each individual data point is listed in the Experimental section.

