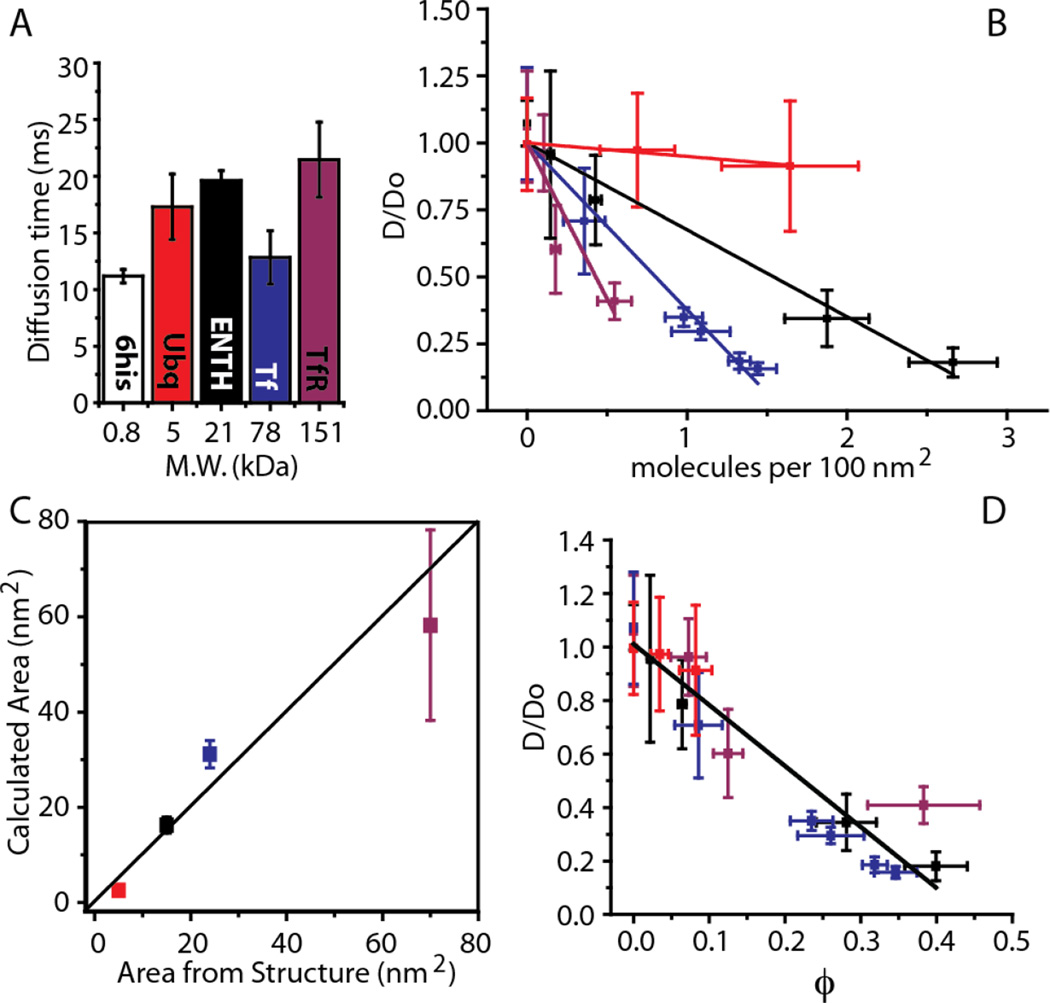
Figure 2.
A single decreasing trend relates diffusivity and membrane coverage for membrane bound proteins with diverse sizes. All legend colors are as in panel A. (A) Characteristic diffusion time under dilute conditions is not a function of molecular size. (B) Normalized diffusivity versus the concentration of membrane bound proteins. The diffusivity data were normalized by the fitted values of Do. The Experimental section contains a detailed description of the linear fit and goodness of fit calculations. (C) Experimentally calculated molecular area (vertical axis) versus predicted molecular area based on crystallographic structures (horizontal axis) (D) Normalized diffusivity versus membrane coverage. In all plots, error bars represent the standard deviation of multiple trials. The number of trials for each individual data point is listed in the Experimental section.

