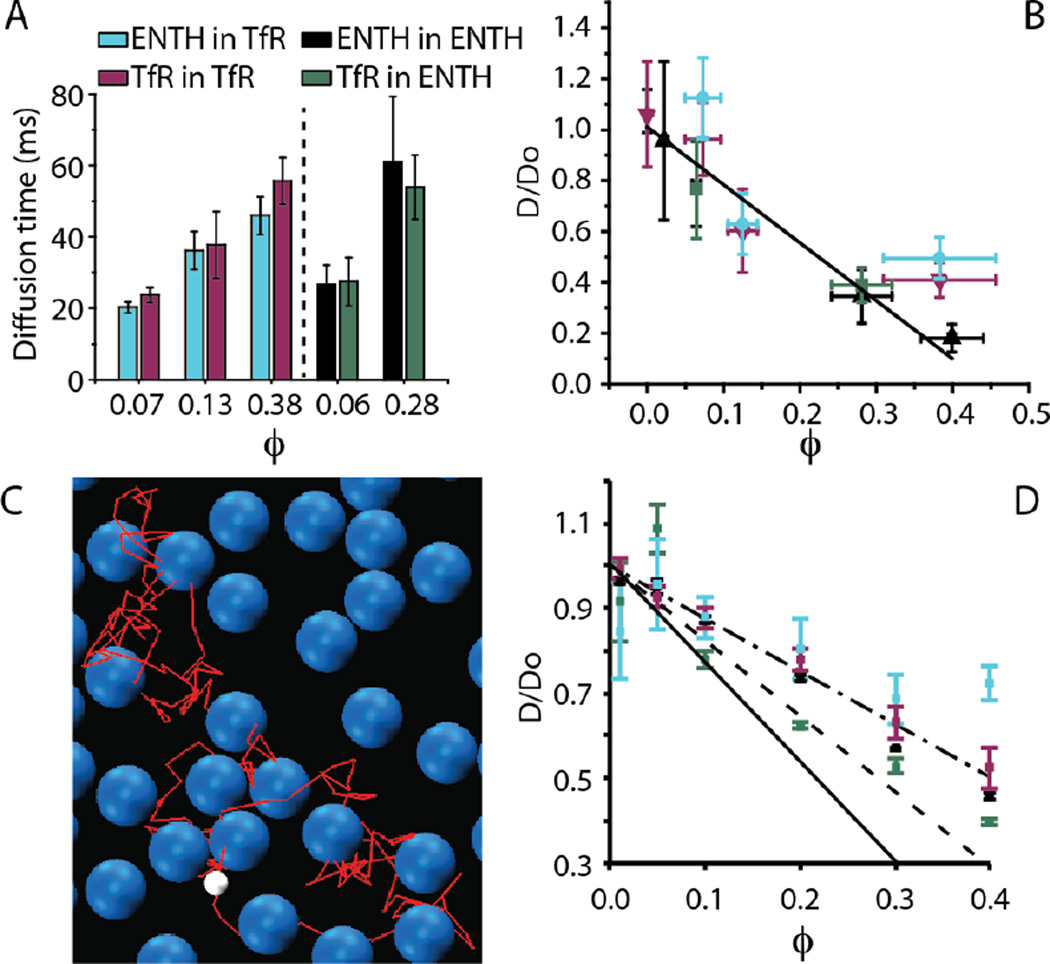
Figure 3.
A steric exclusion model predicts the influence of heterogeneous protein crowding on diffusivity. See panel A for legend. (A) Comparisons of the diffusive time constant for homogeneous and heterogeneous experiments performed at the same membrane coverage. (B) Normalized diffusivity as a function of membrane coverage for homogenous and heterogeneous crowding. See the Experimental section for details of the linear fit. (C) Coarse-grained molecular dynamics simulation of heterogeneous 2-D crowding for the case that the tracer protein is ENTH and the crowding proteins are TfR. The white sphere represents a small ENTH tracer protein. The blue spheres represent larger TfR crowding proteins. The red line represents the path of the tracer protein leading to the current position. (D) MD simulation-derived relationship between normalized diffusivity and coverage for homogenous and heterogeneous crowding, LJ ε=1kBT. Dash-dot line: best fit to plotted simulation points. Solid line: ε=10kBT for TfR-sized particles. Dashed line: hard sphere potential from Cichocki and Hinsen. In all plots, error bars represent the standard deviation of multiple trials. The number of trials for each individual data point is listed in the Experimental section.

