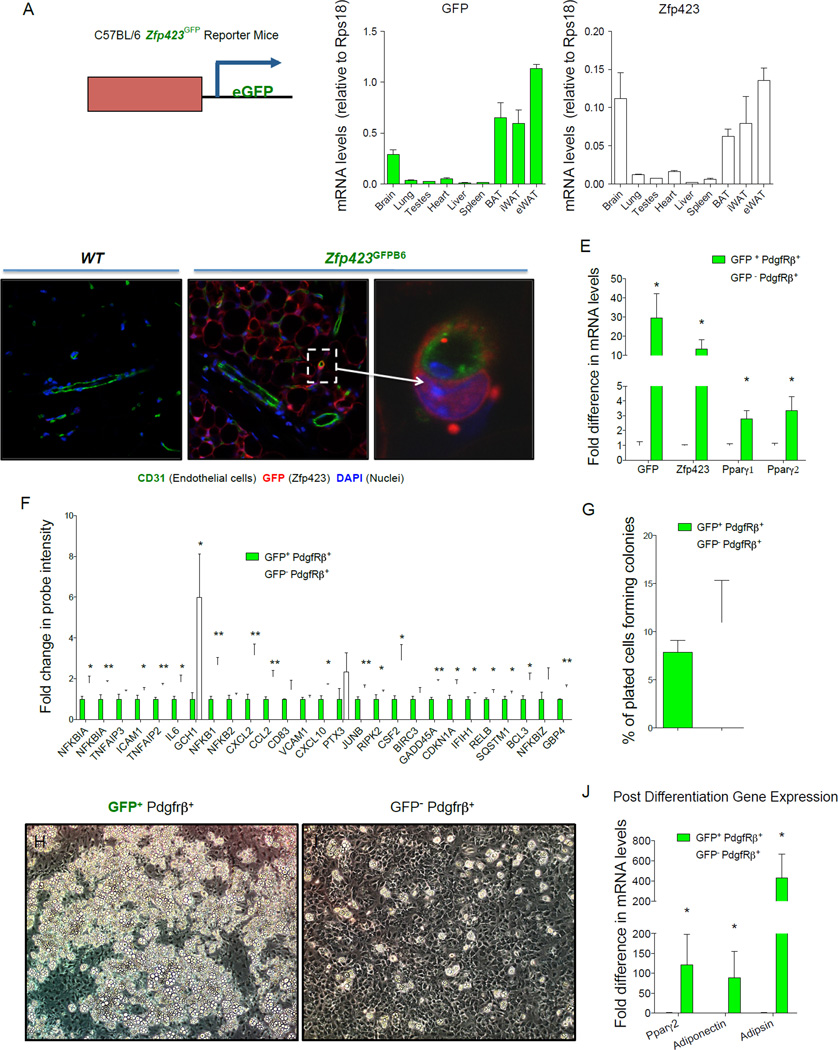
Figure 1. Zfp423-expressing adipose mural cells are lineage-primed adipose precursors.
(A) mRNA levels of GFP and endogenous Zfp423 in different adult tissues isolated from newly derived C57BL/6 Zfp423GFPB6 reporter mice in which enhanced GFP (eGFP) is expressed under the control of a Zfp423-containing BAC. (B–D) Confocal images of cryosectioned inguinal white adipose tissue (WAT) stained with antibodies recognizing GFP (red) and the endothelial protein CD31 (green), with nuclei counterstained with DAPI. (B) WAT from wild-type (WT) mice. (C) WAT from Zfp423GFPB6 mice. (D) Digital enhancement of the small blood vessel shown in (C) (white arrow). Note expression of GFP in mature adipocytes and subset of periendothelial cells. Similar results were observed in gonadal WAT (E). Quantitative PCR measurements of mRNA levels of GFP, Zfp423, and Pparγ isoforms in freshly isolated GFP+ or GFP− mural (Pdgfrβ+; Lin−) cells from the gonadal WAT of male Zfp423GFPB6 mice. * denotes p <0.05 from student’s t-test. Bars represent mean ± SEM. n= 3 samples, with each sample representing cells obtained from pooled tissue from 6–7 male mice. (F) Relative probe intensity values of key inflammatory genes with an overlapping presence in multiple gene sets enriched in GFP− mural cells. Bars represent mean ± SEM. * and ** denotes p <0.05 and p<0.005, respectively (G) Quantification of colony-forming unit potential of freshly isolated GFP+ or GFP− mural cells. n=8 (H–I) Phase contrast images of spontaneous differentiation in cultures of GFP+ (H) and GFP− (I) mural cells maintained at confluence in growth media containing 2% FBS and 1% ITS (insulin, transferrin, and selenium). Images captured 10 days post-confluence. (J) mRNA levels of adipocyte selective genes in differentiated cultures from (H–I) n=3 Bars represent mean ± SEM. * and ** denotes p <0.05.

