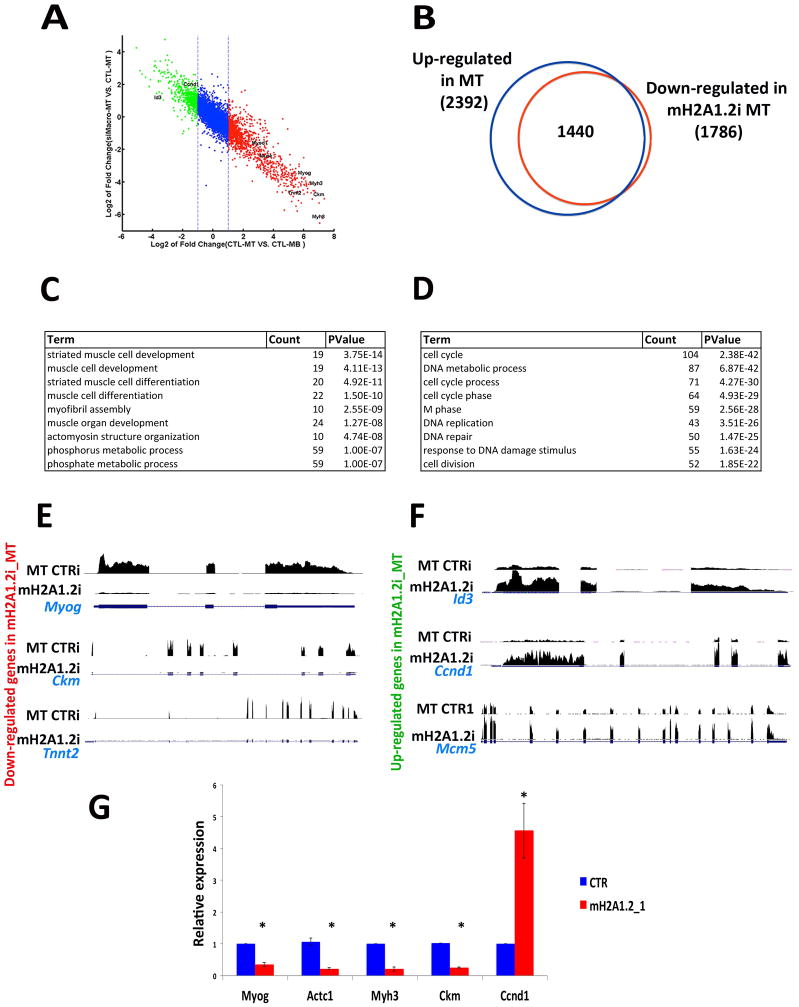
Figure 3. MacroH2A1.2 Regulates the Transcriptome of Differentiating Skeletal Muscle Cells.
(A) Scatter plot shows the inhibitory effect of mH2A1.2 knock down on transcriptome during differentiation. Each dot represents a gene, x-axis shows expression changes during differentiation in CTR, and y-axis shows the expression changes in mH2A1.2i versus CTR in MT. Genes marked red and green are up-regulated and down-regulated during differentiation, respectively. (B) Venn diagram illustrating number of genes up-regulated in control C2C12 MT and down-regulated in counterpart mH2A1.2i cells. (C) Gene ontology (GO) for genes down-regulated in differentiating mH2A1.2i C2C12 cells. (D) Gene ontology (GO) for genes whose transcription remains elevated in differentiating mH2A1.2i C2C12 cells. (E) RNA-seq profiles of down-regulated genes Myog, Ckm and Tnnt2 in differentiating CTRi and mH2A1.2i C2C12 cells. (F) RNA-seq profiles of up-regulated genes Id3, Ccnd1 and Mcm5 in differentiating CTLi and mH2A1.2i C2C12 cells. (G) Myogenin, Actc1, Myh3, Ckm and Ccnd1 mRNAs were evaluated after siRNA against mH2A1.2 in C2C12 cells. Data are represented as mean ± SD, *p<0.01.

