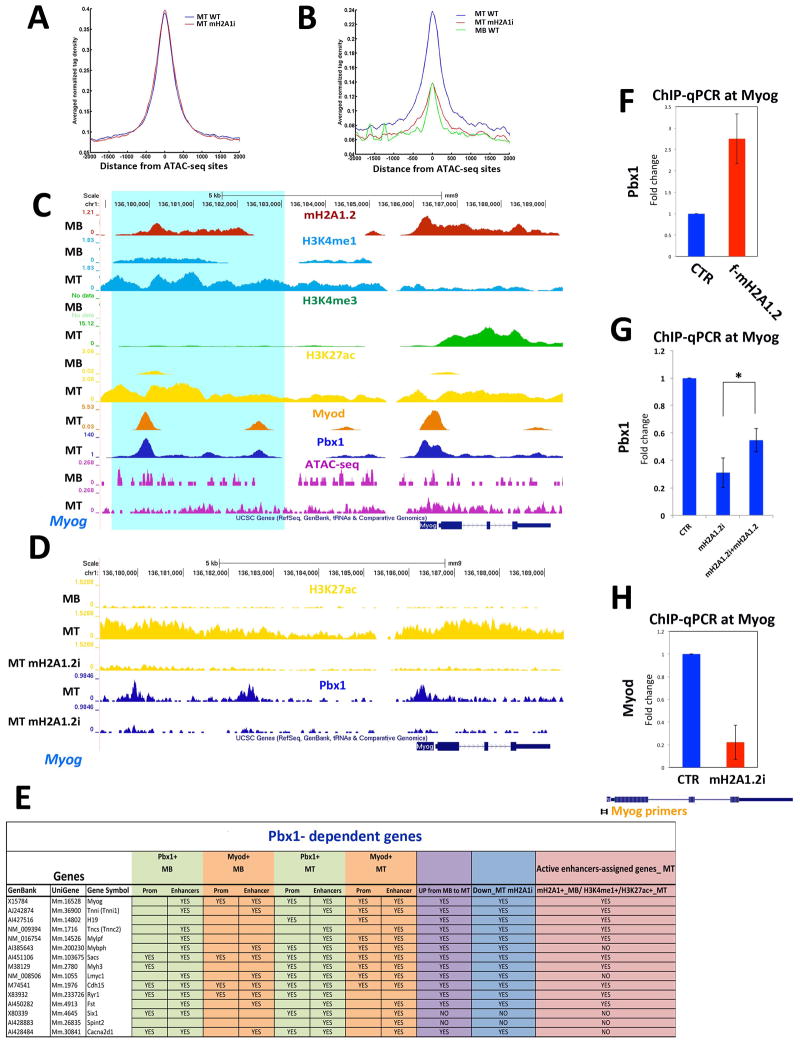
Figure 6. MacroH2A1.2 Regulates Recruitment of Pbx1 at Muscle Enhancer Regions.
(A) Average profile of Pbx1 signal in MT-WT (blue line) and differentiating mH2A1.2i C2C12 cells (red line) at constitutive enhancers; (B) Average profiles of Pbx1 signal in MT-WT (blue line), MT-mH2A1.2i (red line), and in MB-WT at MT-specific enhancers; (C) ChIP-seq tracks at the Myogenin locus. Top to bottom: mH2A1.2 in MT and MB (red tracks); H3K4me1 in MB and MT (light blue tracks); H3K4me3 in MB and MT (green tracks); H3K27ac in MB and MT (yellow tracks); MyoD in MT (orange track); Pbx1 in MT (blue tracks); ATACseq signal in MB and MT (purple tracks). Turquoise shading identifies a H3K27ac+/H3K4me1+/Pbx1+/MyoD+/H3K4me3− region. (D) ChIP-seq tracks at the Myogenin locus. Top to bottom: H3K27ac in MB, MT and MT_mH2A1.2i (yellow tracks); Pbx1 in MT CTR and mH2A1.2i (blue tracks). (E) Summary of Pbx1and MyoD occupancy in MB and MT, expression in MB and MT, expression in mH2A1.2i cells, and assignment to MT-specific enhancers of Pbx1-dependent genes reported in (Berkes et al., 2004). (F) Pbx1 ChIP-qPCR in CTR and mH2A1.2-overexpressing (2 g mH2A1.2 plasmid/1×105 cells). (G) ChIP-qPCR for Pbx1 at the Myogenin locus in control (CTR), mH2A1.2i, and mH2A1.2i C2C12 cells transfected with mH2A1.2 expression vector. Data are represented as mean ± SD, *p<0.01. (H) ChIP-qPCR for MyoD at the Myogenin locus in CTR and mH2A1.2i C2C12 cells. Data are represented as mean ± SD.

