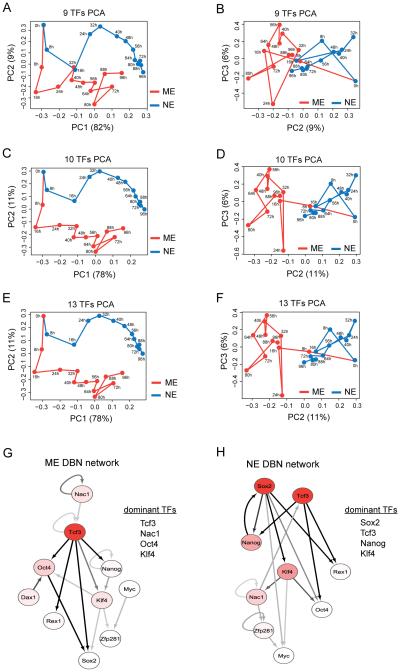
Figure 2. Identification of potential differentiation regulatory TFs by computational analysis.
Principal component analysis (PCA) using the median values of nine pluripotency factors - Oct4, Nanog, Sox2, Klf4, Rex1, Nac1, Zfp281, Dax1 and cMyc (A and B) and these nine plus Tcf3 (C and D) for the ME (red) and NE (blue) conditions. PCA with all 13 measured TFs (E and F). Principal component (PC) projections are shown as PC1 vs PC2 and PC2 vs PC3 plots. Dynamic Bayesian Network (DBN) analysis using median values of the ten TFs (above nine plus Tcf3) for ME (G) and NE (H) differentiation. The nodes are colored using a scale based on dominance scores which have been max-normalized for each network separately: white (0.5 and below), red gradient (0.5 to 1) and red (1). The edges are colored using a scale based on their posterior probability predictions with a threshold of 0.25: off-white (0.25), gray scale (0.25 to 0.5) and black (above 0.5). The extent of connectivity measured by dominance scores indicated the top four factors in the ME (G) and NE (H) networks. DBN networks are drawn using Cytoscape. See also Figure S2 and experimental procedures.

