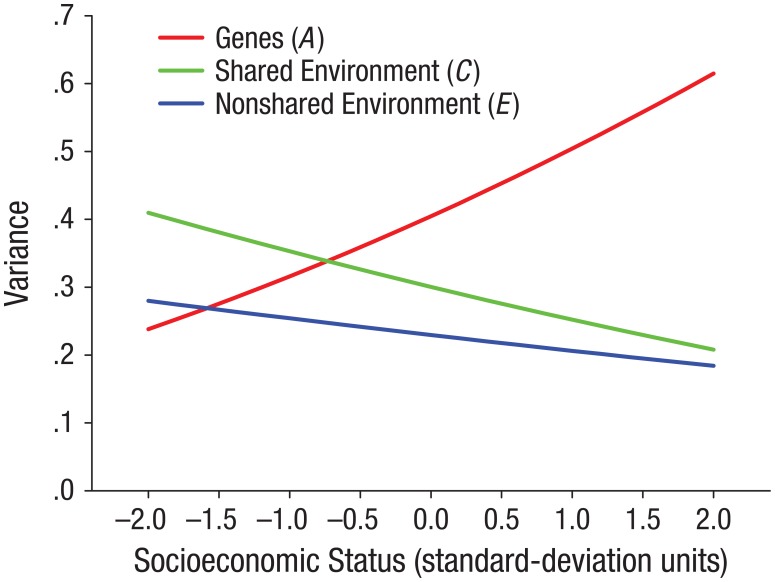
Fig. 1.
Variance in cognitive-test performance for the U.S. sample accounted for by genetic and environmental factors, graphed as a function of socioeconomic status (SES). Cognitive test scores were standardized to a z scale within each data set prior to model fitting. This plot is very close to (but not identical with) a plot in which the y-axis represents the instantaneous proportion of variance for each level of SES.

