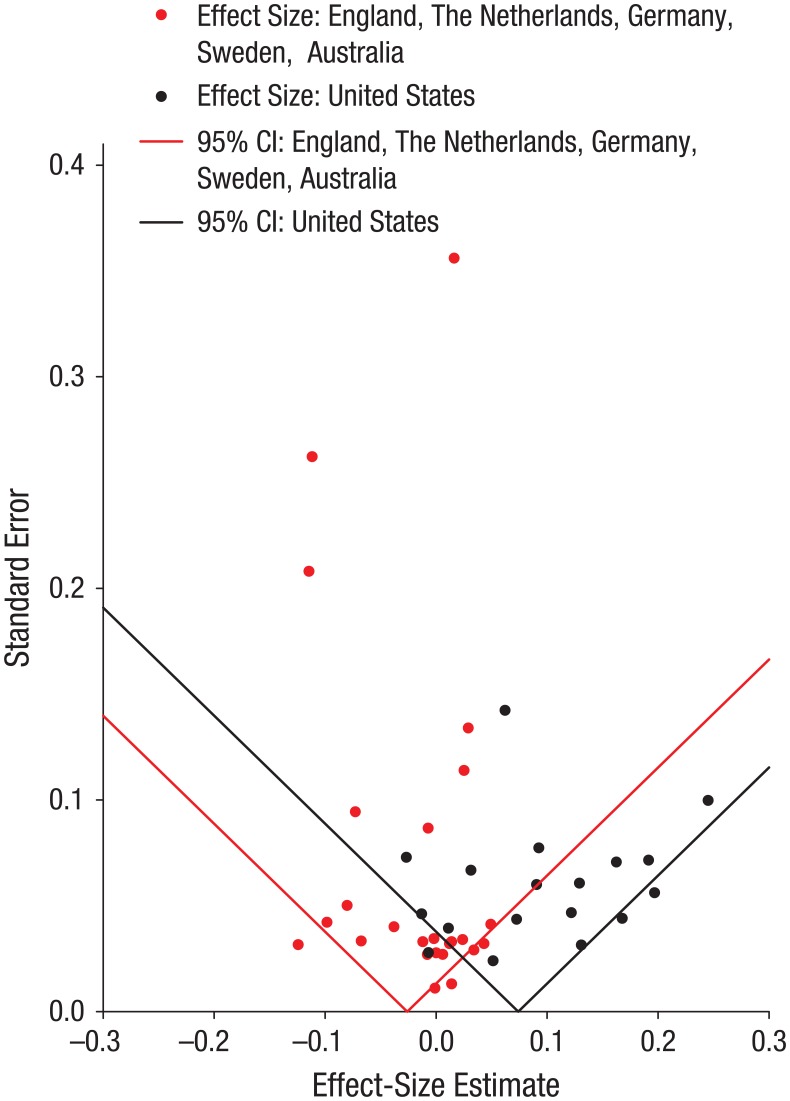
Fig. 2.
Funnel plot of effect-size estimates for the Gene × Socioeconomic Status interaction in the U.S. and non-U.S. samples. Each plotted point represents the standard error and effect-size estimate for a study included in the meta-analysis. The triangle-shaped regions indicate where 95% of the data points should lie if there is no (within-group) heterogeneity in population effect sizes. CI = confidence interval.

