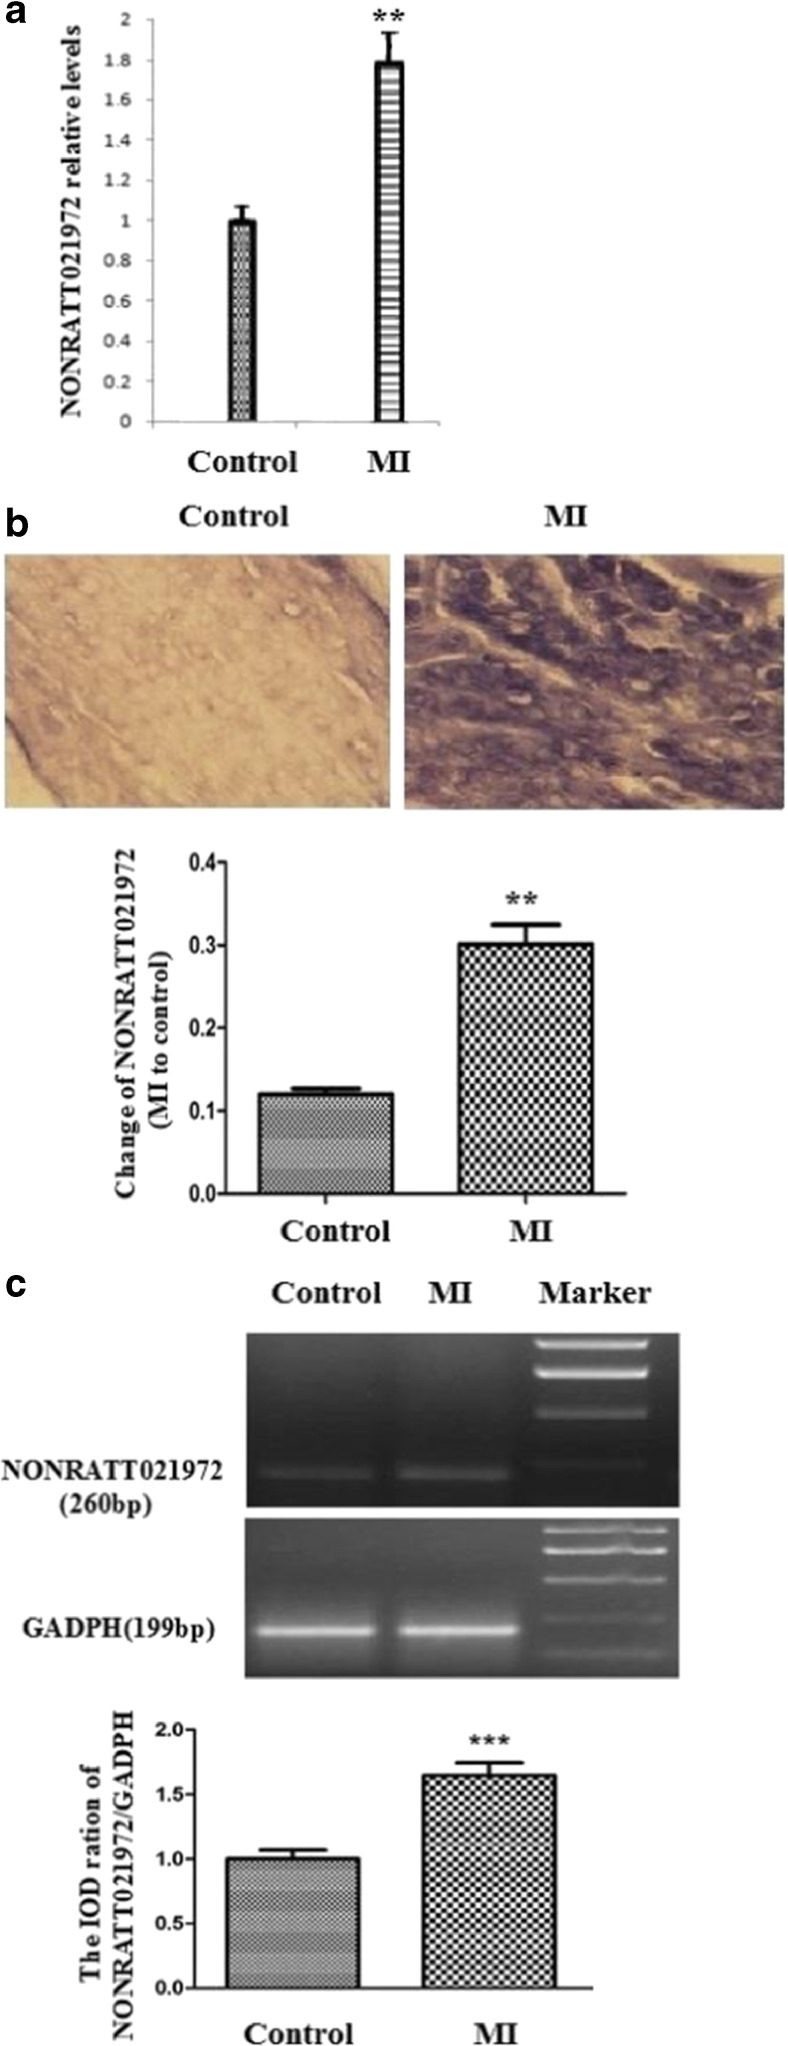
Fig. 1.
Expression levels of NONRATT021972 in SG. a The histogram of relative mRNA levels. The expression levels of NONRATT021972 in SG were significantly higher in the MI group than the Con group (p < 0.01). , n = 3. **p < 0.01 compared to the Con group. b The expression of NONRATT021972 in SG is significantly higher in the MI group than the control group assessed using ISH (p < 0.01). c Serum NONRATT021972 concentrations in patients with coronary heart disease were higher compared to control healthy subjects as assessed using RT-PCR (p < 0.05, n = 8 for each group)

