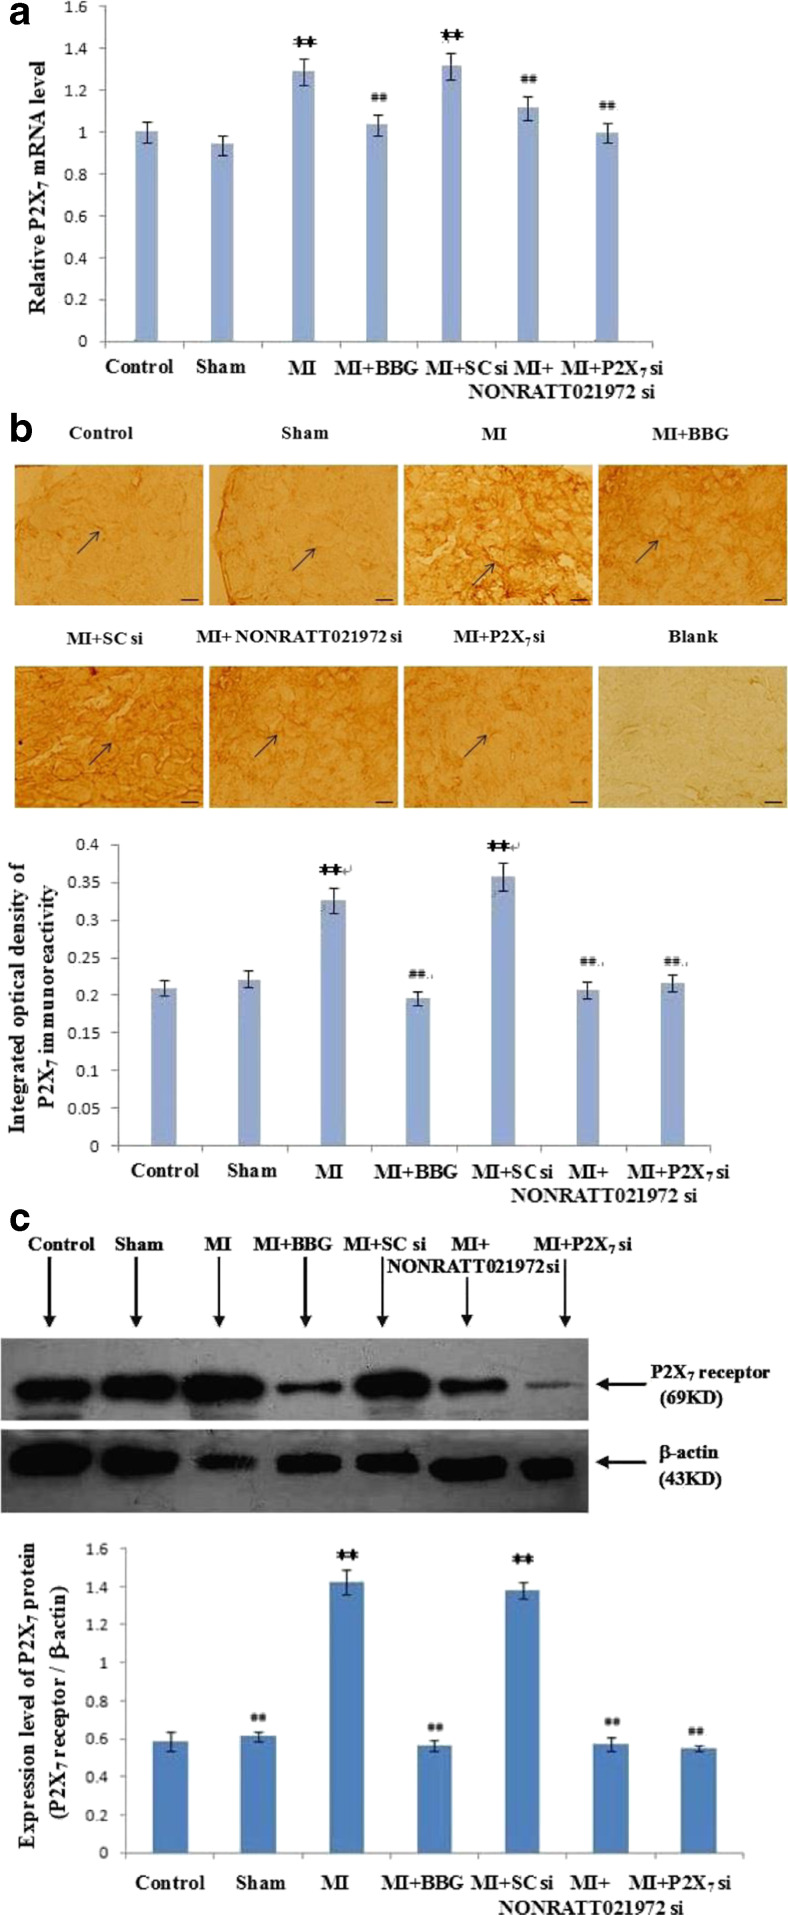
Fig. 3.
The expression levels of P2X7 receptor mRNA, immunohistochemistry, and protein in SG of each group. a The expression levels of P2X7 receptor mRNA in SG were measured using quantitative real-time PCR. Histogram shows the relative mRNA levels. , n = 3. **p < 0.01 compared to the Con group; ##p < 0. 01 vs. the MI group. b Representative photos of P2X7 immunoreactivity in SG were measured using immunohistochemistry. Histogram shows the IOD of the results. Arrows indicate immunostained neurons. , n = 10. **p < 0.01 compared to the Con group; ##p < 0. 01 vs. the MI group. Scale bars at 20 μm. c Representative photos of P2X7 protein immunostaining in SG were measured using Western blots. Histogram shows the IOD of the results. , n = 6. **p < 0.01, compared to the Con group; ##p < 0. 01 vs. the MI group

