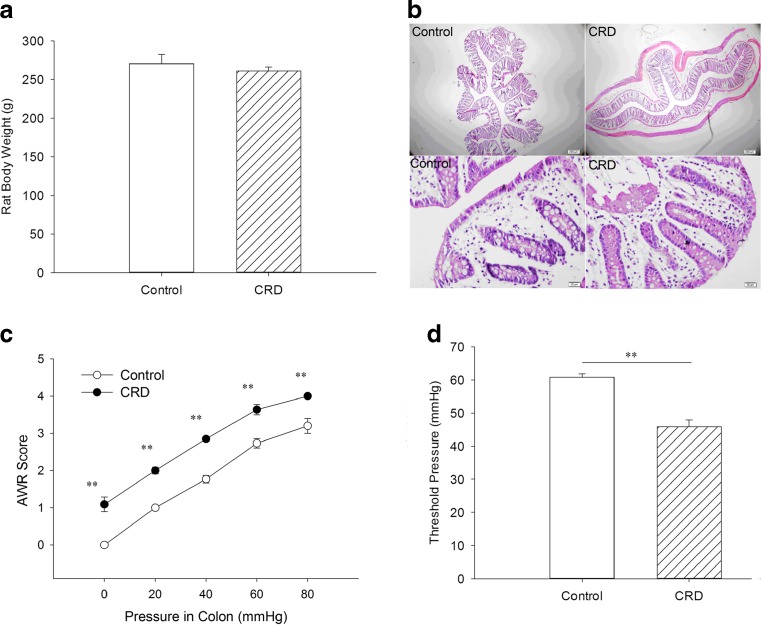
Fig. 2.
The difference of rat body weight (a), colon wall slice pathological morphology (b), the graded CRD AWR score (c), and the threshold intensity of CRD (d) between adult rat chronic visceral hypersensitivity model and control group. Figure 2a and b showed that the rat body weight and the colon wall slice pathological morphology and inflammatory infiltration performance (stained by H&E, up 40×, below 400×) have no significant differences between the control and NCRD groups. Figure 2c and d revealed that there were extremely significant differences between the control and NCRD groups in terms of the graded CRD AWR score and the threshold intensity of CRD. **P < 0.01, compare to control group, n = 6

