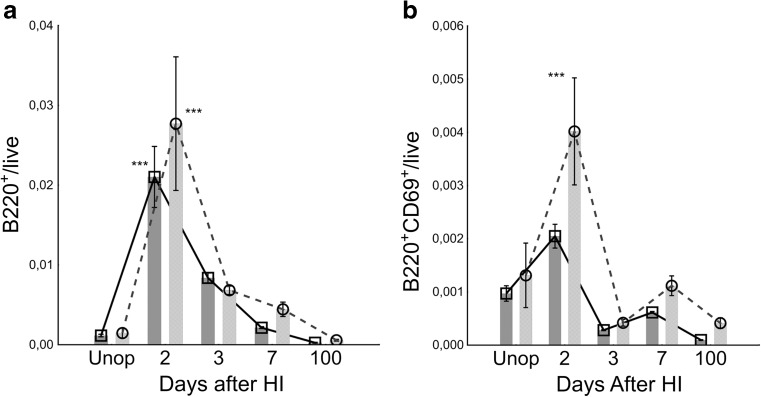
Fig. 2.
Temporal B lymphocyte brain infiltration and activation pattern in WT C57/Bl6 mice after HI. a Number of brain-infiltrating B220+ B lymphocytes in the infarcted ipsilateral hemisphere (circles, light grey bars) and undamaged contralateral hemisphere (squares, dark grey bars). Two days after HI, a highly significant influx of B lymphocytes was observed which then declined. b The number of activated CD69+ B lymphocytes increased 2 days after HI. n = 6 day 11, n = 7 day 12, n = 6 day 17, n = 6 day 24, n = 7 day 100, and n = 3 day 200. Error bars indicate SE. Data analysis performed by manual gating. ***p < 0.001

