. 2016 Jan 7;5:e11583. doi: 10.7554/eLife.11583

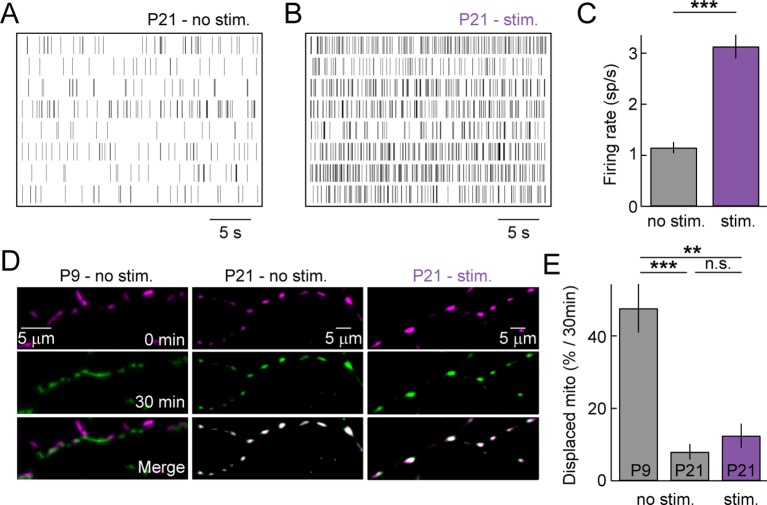
Figure 5. Sensory-evoked neuronal activity and mitochondrial motility at maturity.

(AB) Spike raster plots of eight representative RGCs recorded in darkness (A) and during presentation of a full-field white noise stimulus (B, see 'Materials and methods'). (C) Bars (error bars) indicate the mean (± SEM) firing rates of RGCs (n = 334 RGCs, 3 retinas, p<10–26). (D) Representative RGCs expressing mtCFP at t = 0 min (top panels), t = 30 min (middle panels) after being exposed to white noise stimulus (right panels) or kept in darkness (left and center panels). Bottom panels show merged images of t = 0 and t = 30 min. (EBars (error bars) indicating the mean (± SEM) of % mitochondria displaced between t = 0 min and t = 30 min (P9 – no stim. n = 5 RGCs, P21 – no stim. n = 5 RGCs, P21 – stim n = 5 RGCs). RGCs, retinal ganglion cells.

DOI: http://dx.doi.org/10.7554/eLife.11583.013

Figure 5.

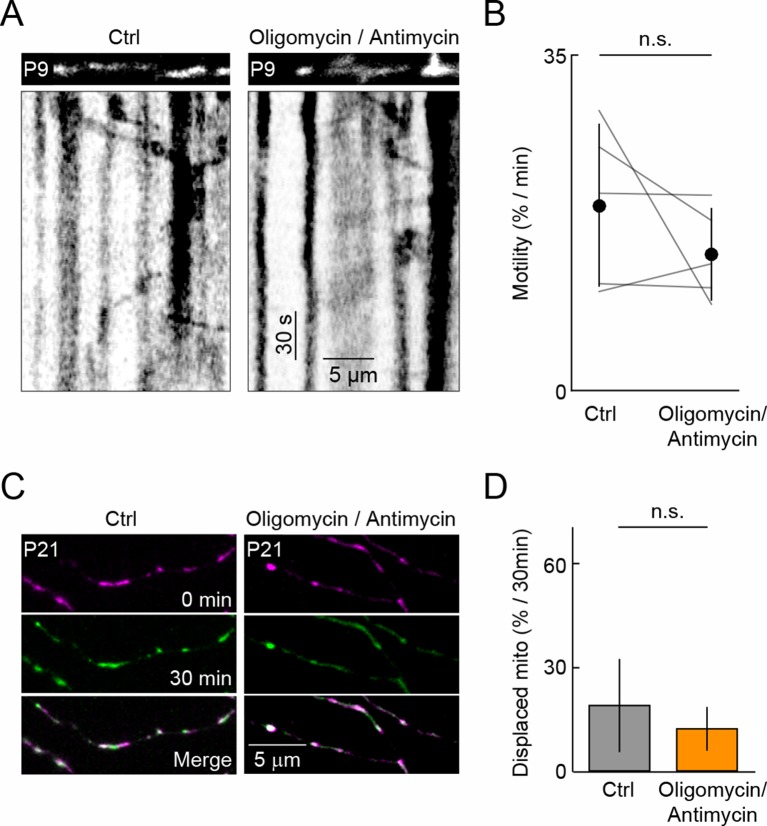
Figure 5—figure supplement 1. Antimycin A and Oligomycin and mitochondrial motility.

Figure 5—figure supplement 1.

(A) Kymographs of representative time-lapse imaging series of mitochondria (mtDsRed, 0.9 fps) in a P9 RGC before (left) and after Oligomycin/Antimycin A application. Top panels show still frames at t = 0s of the branch segments depicted in the kymographs in the bottom panels. (B) Paired plots of RGC mitochondrial motility before and after 30 min of 10 µM Oligomycin/ 4 µM Antimycin A application at P9 (n = 5 RGCs, p>0.2). (C) Representative images of P21 RGCs expressing mtDsRed at t = 0 min (top panels), t = 30 min (middle panels) in the presence (right panels) or absence (left panels) of Oligomycin/Antimycin A. Bottom panels show merged images of t = 0 and t = 30 min. (D) Bars (error bars) indicating the mean (± SEM) of % mitochondria displaced between t = 0 min and t = 30 min (n = 4 RGCs, p>0.4). fps, frames per second; RGC, retinal ganglion cell.