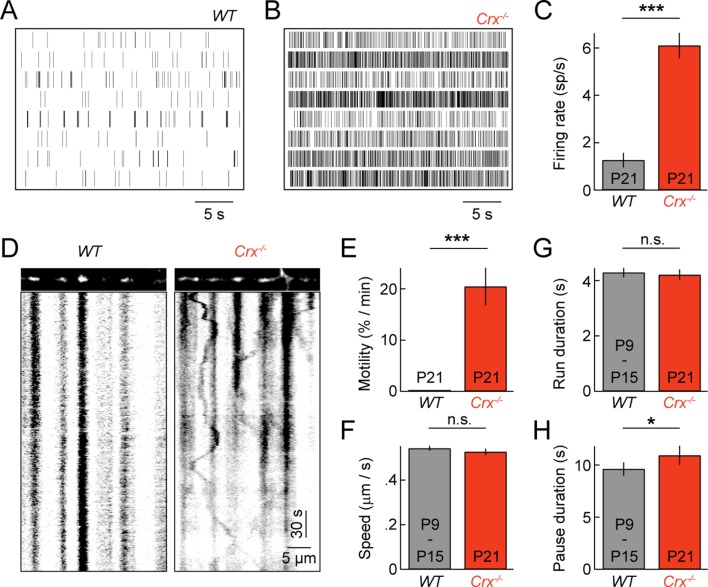
Figure 6. Pathological hyperactivity and dendritic mitochondria in retinal degeneration.
(A, B) Spike raster plots of eight representative RGCs recorded from P21 WT (A) and from P21 Crx-/- retinas (B). (C) Bars (error bars) indicating the mean (± SEM) firing rates of WT and Crx-/- RGCs (WT n = 100 RGCs, 3 retinas, Crx-/- n = 235 RGCs, 3 retinas, p<10–8). (D) Kymographs of representative time-lapse series of a P21 WT RGC (left panels) and Crx-/- RGC (right panels). (E) Bars (error bars) indicating the mean (± SEM) motile fraction of mitochondria in P21 WT and Crx-/- dendrites (P21 WT n = 7 RGCs, Crx-/- n = 6 RGCs). (FH) Bars (error bars) indicating the mean (± SEM) mitochondrial speed during uninterrupted motion (F), duration of uninterrupted runs (G), and duration of pauses (H) for mitochondria in P9 – 15 WT and Crx-/- dendrites (Crx-/- n = 30 mitochondria, pooled WT P9 and P15 n = 97 mitochondria). RGC, retinal ganglion cell.

