. 2015 Dec 9;4:e08497. doi: 10.7554/eLife.08497

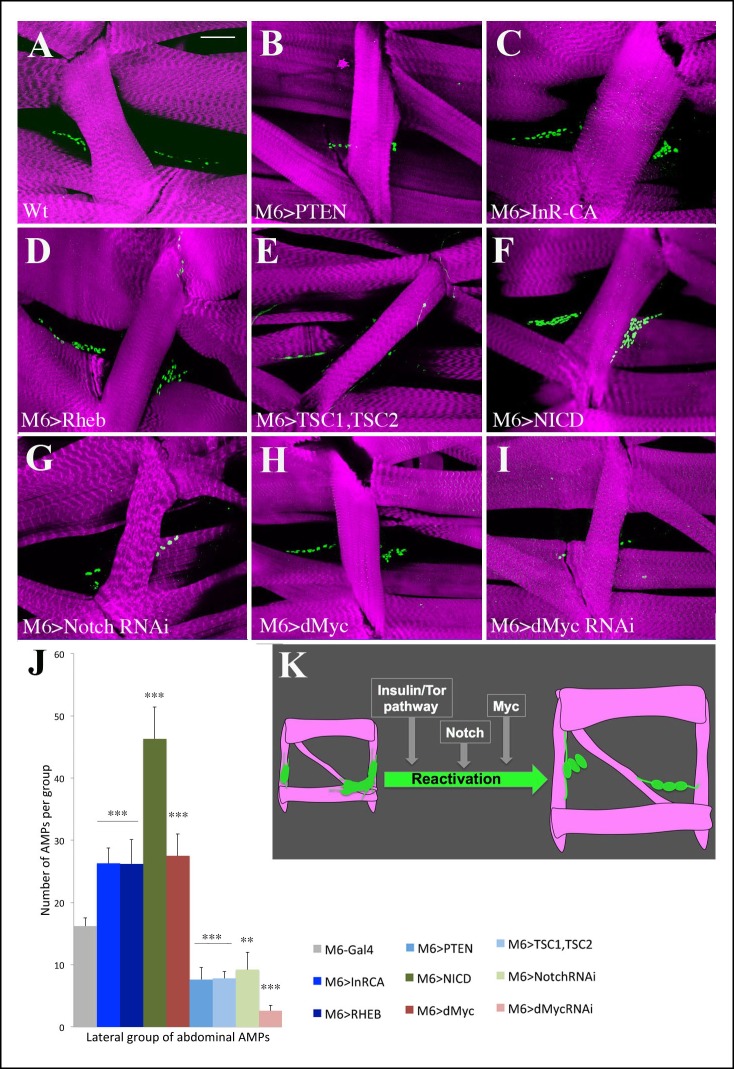
Figure 4. Insulin/TOR and Notch pathways control AMP reactivation in larval stages.

(A–I) Flat preparations of the mid-stage matched third-instar larvae stained for Twist (green) labeling AMP nuclei and stained for Phalloidin (magenta) labeling the larval muscles. The abdominal lateral group of AMPs is shown in (A) representative control larva (M6-Gal4) and (B–I) in larvae with modified Insulin, TOR, Notch and Myc expression. M6-Gal4 driver is used to AMP-specifically drive the expression of: (B) PTEN, an inhibitor of the Insulin pathway; (C) InR-CAAX, a constitutively activated form of insulin receptor; (D) RHEB, an activator of the TOR pathway; (E) TSC1, TSC2, a complex of two proteins that inhibits the TOR pathway; (F) NICD, Notch intracellular domain that constitutively activates the Notch pathway; (G) dsRNA against Notch transcript; (H) overexpression of dMyc; (I) dsRNA against dMyc transcript. (J) Graphical representation of the mean number of lateral AMPs in the different genetic contexts shown in (A–I). (***) indicates P≤0.001. Scale bar: 36 microns. (K) A scheme illustrating the promoter influence of Insulin and Notch pathways and Myc on AMP reactivation.

DOI: http://dx.doi.org/10.7554/eLife.08497.014

Figure 4—source data 1. Table showing mean number of dorsal, lateral and ventral AMPs in the abdominal segments from the genotypes shown in Figure 4A–I and Figure 4—figure supplement 1.
For each genotype, the average number of cells ± standard error mean is shown. Sample size (n) is indicated in brackets (Rebay et al., 1993).
DOI: 10.7554/eLife.08497.015

Figure 4.

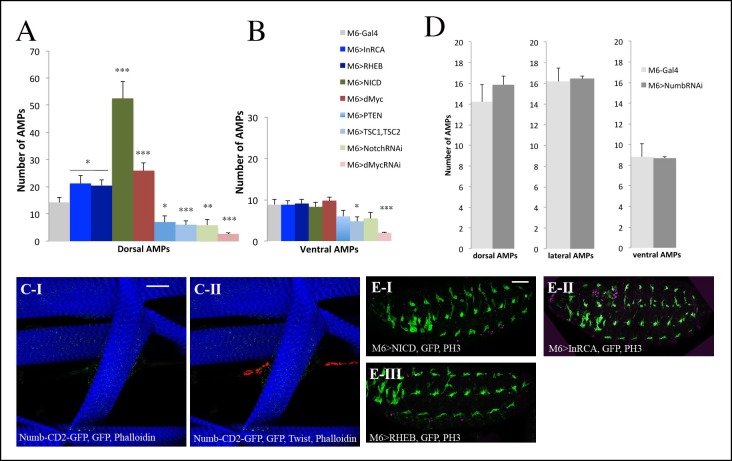
Figure 4—figure supplement 1. Influence of Insulin, TOR, Notch and Numb on AMP cell number in larval stages and in embryos.

Figure 4—figure supplement 1.

(A, B) Graphs representing the mean number of AMPs from the dorsal and ventral abdominal groups of mid-3rd instar larvae from the genotypes shown in Figure 4A–I. (***), (**) and (*) indicate P≤0.001, P≤0.01 and P≤0.05, respectively. P-values were computed using t test and Prism software with Gal4 as a control sample. (C-I) and (C-II) Flat preparation of a mid-stage matched Numb-CD2-GFP 3rd-instar larva stained for Numb-GFP (green), Twist (red) and Phalloidin (blue). Note the absence of Numb-GFP in AMPs. (D) A graph showing mean number of dorsal, lateral and ventral AMPs from the mid-stage 3rd-instar control larvae (M6-GAL4) and from the larvae with AMP-targeted attenuation of numb. (E) Lateral views of stage 15 embryos. Targeted activation of Notch (E-I), Insulin (E-II), and TOR pathway (E-III) in AMPs does not lead to precocious reactivation of AMPs in embryos. Embryos are stained for GFP (green) to visualise the AMPs and for proliferation marker PH3 (magenta). Note that no expression of PH3 is seen in AMPs in these contexts. Scale bars in (C): 36 microns; in (E): 30 microns.
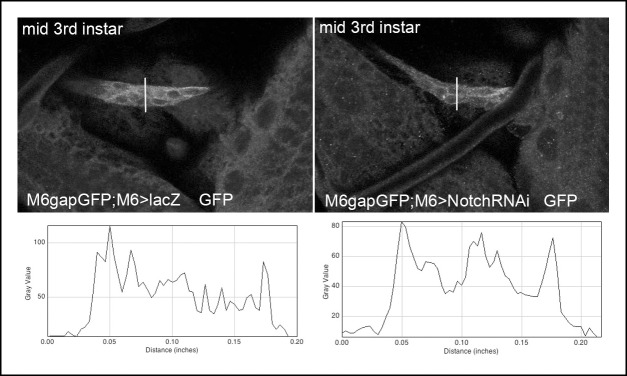
Figure 4—figure supplement 2. M6-Gal4 driver keeps active in Notch attenuation context.

Figure 4—figure supplement 2.

Representative images showing m6-driven GFP signal associated with the anterior cluster of lateral AMPs in wt (lacZ context) and in larvae with reduced Notch (Notch RNAi context) acquired with the same confocal settings. Graphs of fluorescence intensity made with ImageJ Plot plugin (along the traced lines) are shown below. Notice that mean fluorescence signal in Notch RNAi context when compared to wt is reduced of about 10%.