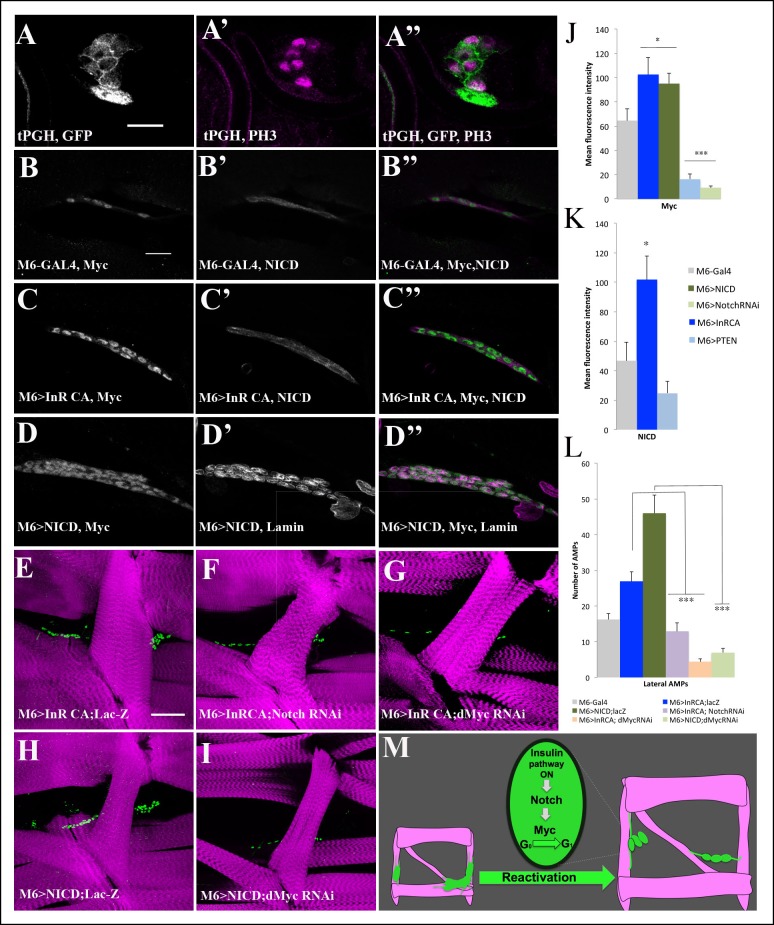
Figure 5. Myc acts downstream of Insulin and Notch pathways during AMP reactivation.
(A, A”) A single cluster of AMPs from the tPGH third-instar larvae stained for GFP to reveal activation of PI3K/Insulin pathway and for phospho-histone H3 (PH3) to identify AMPs that undergo proliferation. Note that PH-GFP localizes to the cell membranes, indicating the activity of PI3K/Insulin signaling in AMPs that proliferate. (B–D”) Single clusters of third-instar larva lateral AMPs stained for dMyc and NICD (B–C”) and for dMyc and Lamin (D–D’’). (B, B”) Control m6-GAL4 larva. (C, C”) m6-GAL4-driven expression of Inr-CAAX in AMPs upregulates dMyc and NICD expression. (D, D”) Targeted expression of NICD in AMPs results in an increased dMyc signal in AMPs. (E–I) Double transgenic mutant contexts and their effects on number of lateral AMPs. Attenuations of Notch (F) and dMyc (G) rescue the InRCA-induced overproliferation phenotype. Similarly, attenuating dMyc in AMPs expressing NICD dramatically reduces AMP numbers (I) compared to NICD context (H). (J) Mean fluorescence intensity of the dMyc signal detected in loss- and gain-of-function contexts for Insulin and Notch pathway components. (K) Mean fluorescence intensity of the NICD signal detected in InRCA and PTEN contexts. (L) Mean number of lateral AMPs counted in different genetic contexts shown in (E–I). (***) and (**) indicate P≤ 0.001 and P≤ 0.01, respectively. Scale bars are (A, A”): 9 microns; (B–D”): 15 microns; (E–I): 45 microns. (M) Schematic illustration of genetic hierarchy between Insulin, Notch and Myc during AMP reactivation.
DOI: http://dx.doi.org/10.7554/eLife.08497.018
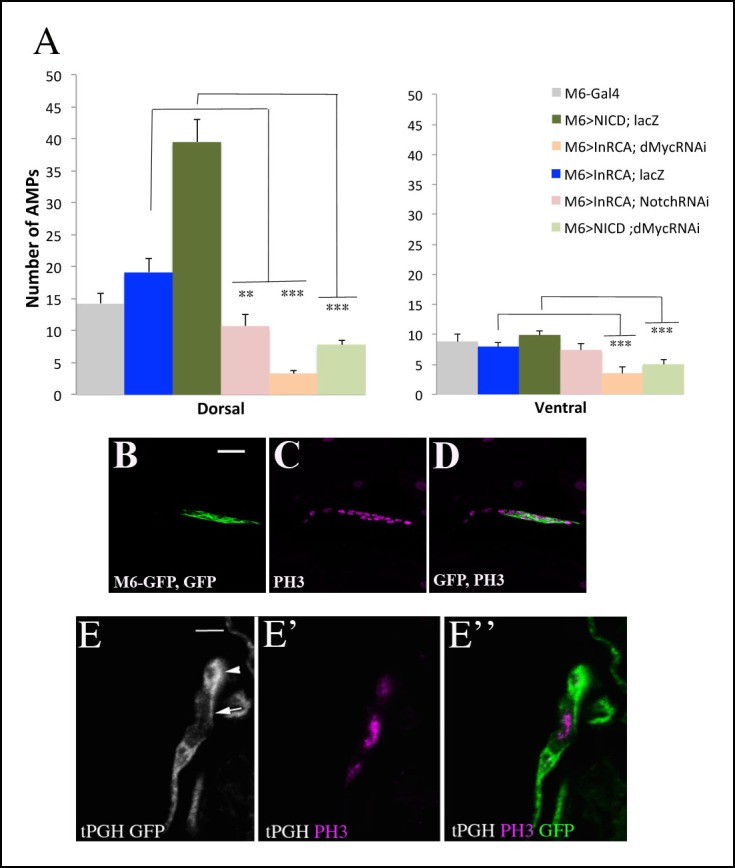
Figure 5—figure supplement 1. Proliferation of AMPs is positively regulated by Insulin, Notch and their downstream target Myc.


