. 2016 Feb 1;5:e08494. doi: 10.7554/eLife.08494

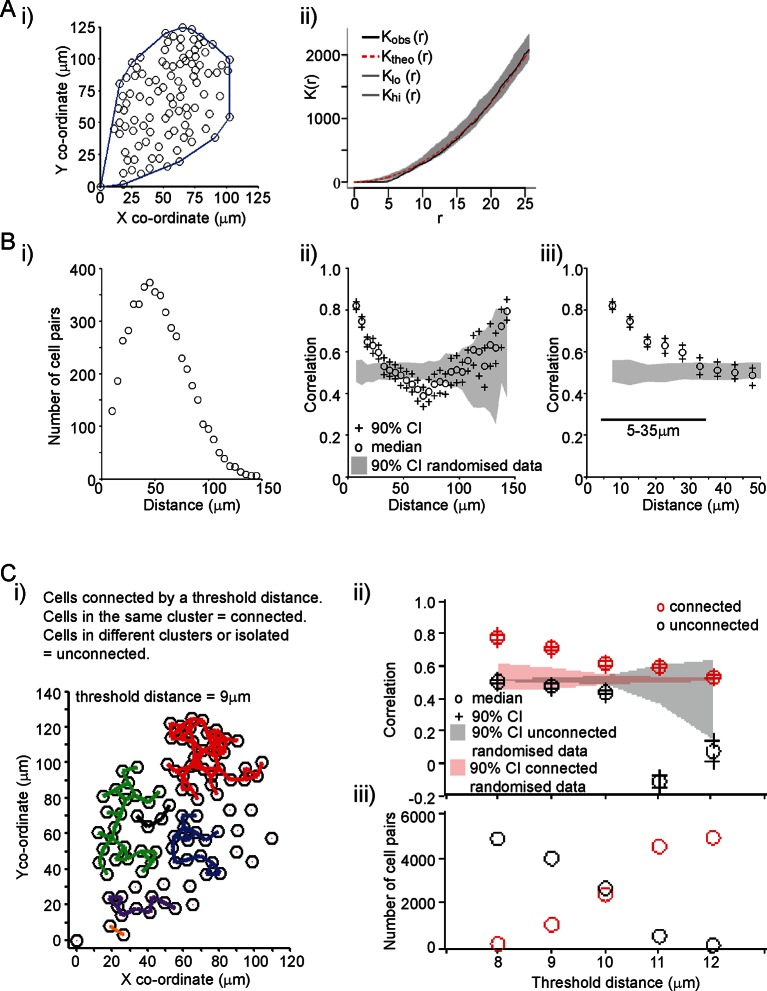
Figure 3. Spatial organisation of transcription activity in pituitary tissue.

(A) Assessment of the spatial distribution of lactotroph cells with PRL gene transcriptional activity. i) The median position of the cells over the time-course along with the field or convex hull occupied by the cells. ii) Ripley’s k function was used to test whether the cellular distribution was random. The observed distribution (Kobs (r)) deviates from the theoretical prediction (Ktheo (r)) in the short r range due to the finite size of the cells, above which the cell distribution is found to be indistinguishable from random and within the 95% confidence interval (Klo (r) – Khi (r)). (B) Correlation vs distance analysis of cells from adult male pituitary tissue. The correlation between two time series xi and yi measured at N times is defined as N1i=1Nxiyi. i) The distribution of distances between cell pairs. Correlation vs distance plots ii) all cell data and iii) cell pairs within 50 µm; indicate that proximally located cells have more similar activity than cells located further apart. The median and 90% confidence interval (CI) are shown along with the profile obtained from the 90% confidence interval of randomised of cellular transcription patterns. The range shown indicates the distances over which the randomised data were significantly greater (paired t-test, p<0.001) to the non-randomised data. (C) Analysis of correlation mediated by a potential lactotroph cell network in adult male pituitary tissue. i) Cell connectivity map with cells classified as connected or unconnected according to the threshold distance used. Connections between cells at a single time point are portrayed. ii) Correlation was calculated between connected (red) and unconnected cells (black) in parallel with randomised data. iii) The number of connected and unconnected cell pairs at various threshold distances. Connected cells were more correlated in their transcription activity than unconnected cells. Cell connectivity in ii)-iii) are based on median cell distances across the time-course to take into account cell movement. Data shown are representative of three independent experiments. PRL, prolactin.

DOI: http://dx.doi.org/10.7554/eLife.08494.007

Figure 3.

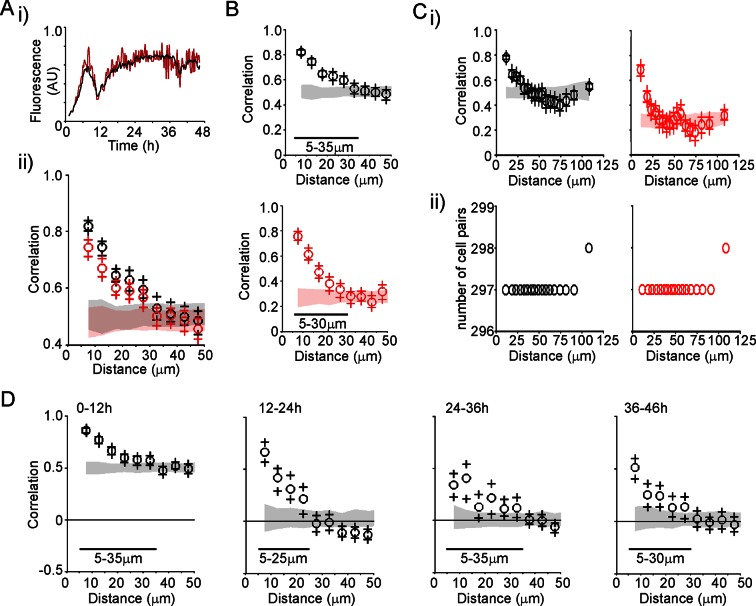
Figure 3—figure supplement 1. Characterisation of spatial organisation of prolactin transcription activity.

Figure 3—figure supplement 1.

(A) Spatial correlation between proximally positioned cells was not due to restricted resolution in the imaging data. The regions of interest (ROI) analysed were collapsed to 25% of the original area to ensure correlation was not due to overlap of signal between cells. i) An example cell shows that this method caused the fluorescence signal to show large fluctuations in intensity but with the pattern of activity maintained. This is probably due to less averaging of signal intensity due to the smaller number of pixels. ii) The pattern of correlation over distance was maintained for both sizes of ROIs (100% ROI in black and 25% ROI in red) showing that imaging resolution was not a factor in causing increased correlation between proximally located cells. (B) Spatial correlation was maintained when imaging was performed at differing levels of sensitivity (as discussed in Figure 2—figure supplement 1). The correlation vs distance analyses show similar results for the two levels of signal detection (sensitive detector shown in black, insensitive detector shown in red), although the absolute value of correlation changes due to the inclusion of either saturated values or zeros. Ranges shown indicate the distances over which the randomised data were significantly greater (paired t-test, p<0.001) to the non-randomised data. Data were calculated in bins of 5 µm. (C) Spatial organisation of transcription was maintained when the number of cell pairs in each bin was normalised. Correlation vs distance plots are shown (i) along with the number of cell pairs in each bin (ii). Graphs are coloured as in (B). (D) Spatial organisation of transcription activity is maintained over 48 hr. Correlation of transcription patterns was not solely due to the stimulation of cell activity by the removal of dopamine as this correlation was maintained between proximally located cells over 48 hr and after 24 hr when hPRL-d2EGFP reporter gene activity declined. Data shown are from the sensitive detector, although similar results were obtained with data from the insensitive detector (not shown). Correlation vs distance plots are shown as described in Figure 3B.
Figure 3—figure supplement 2. Correlation of transcription profiles within a cellular network structure.
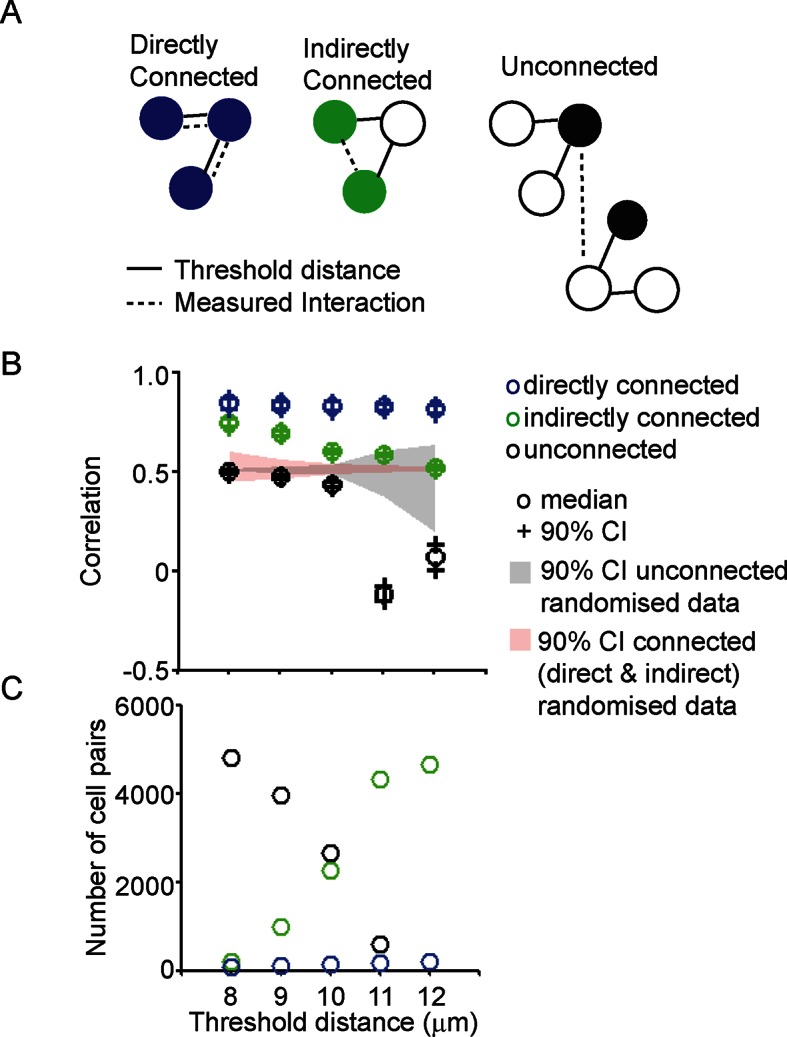
Figure 3—figure supplement 2.

(A) Schematic showing the classification of cells into directly connected, indirectly connected and unconnected cell groups. (B). Analysis of correlation between different cell groups (classified as pictured in A) with connections calculated using a defined threshold distance. Correlation was calculated in parallel with randomised data. (C) The number of directly connected, indirectly connected, and unconnected cell pairs at various threshold distances. Directly connected cells were more correlated in their transcription activity than indirectly connected or unconnected cells. Cell connectivity in (B) and (C) are based on median cell distances across the time-course to take into account cell movement. Data shown are from the same experiment in Figure 3C and are representative of three independent experiments.