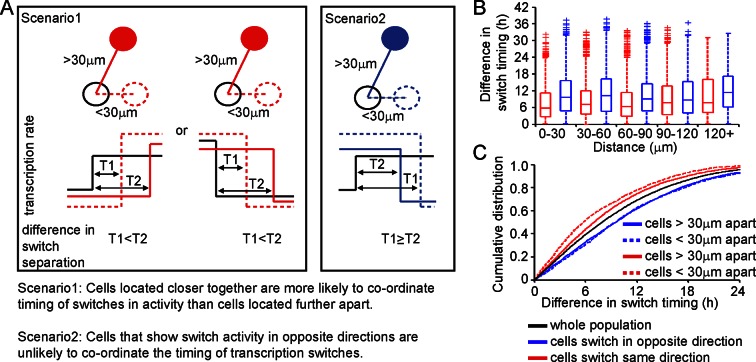
Figure 4. Spatial organisation of stochastic switch model derived prolactin transcription dynamics.
(A) Schematic outlining the hypothesis that was used to assess the spatial organisation of PRL transcription dynamics. The hypothesis was that two cells located closer together will tend to switch transcription in the same direction with more synchronous timing than cells that are located further apart. Moreover, a similar co-ordination in the timing of switches will not be observed if switches occur in the opposite direction. Comparisons are made to the index cell (black). Red denotes cells that switch transcription rate in the same direction, blue denotes cells that switch transcription rate in the opposite direction. T1 is the time interval between cells located within 30 μm (and dashed lines) and T2 is the time interval between cells located more than 30 μm apart (and solid lines). (B) Graph showing boxplots of switch timing intervals in cells that switch in the same direction and cells that switch in different directions, binned by the distance between cells. A rising trend is seen in the time interval between transcription rate switch events in cells that switch activity in the same direction (red), but not in cells that switch activity in the opposite direction (blue). Specifically, the median time interval between switch events is smallest in cells that are located within 30 μm and that switch activity in the same direction. Cumulative distributions and significance testing of these differences are shown in (C). All pairwise switches are considered. Boxplots represent the median and interquartile range (IQR), with whiskers drawn 1.5xIQR away from the lower and upper quartile. (C) The cumulative distribution of the time interval between switch events shows that cells within 30 µm that switch activity in the same direction (red dashed line) do so within a smaller time frame than cells located greater than 30 µm apart (red solid line), the unsorted population (black) and cells that switch activity in opposite directions (blue dashed and blue solid lines) (confirmed by significant p-value <0.01 of Kolmogorov-Smirnov tests). These were calculated by sampling at random, a pair of possible transcriptional profiles for each pair of cells. Data shown were pooled from three independent experiments.

