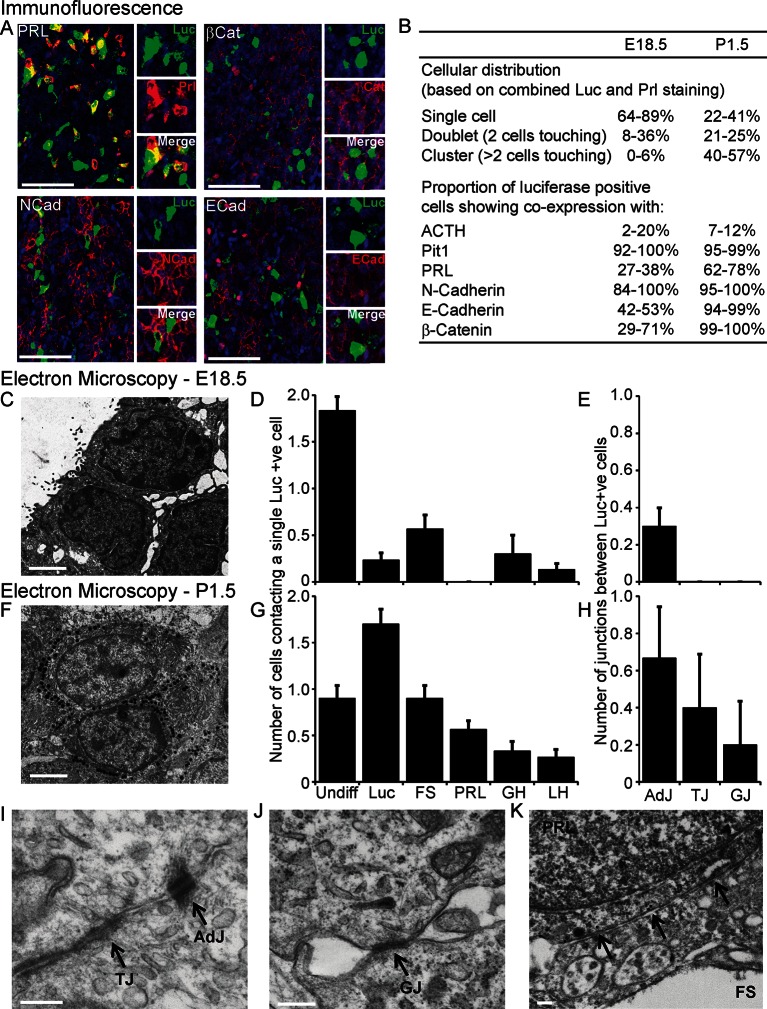
Figure 5. Characterisation of cell signalling potential in immature pituitary glands.
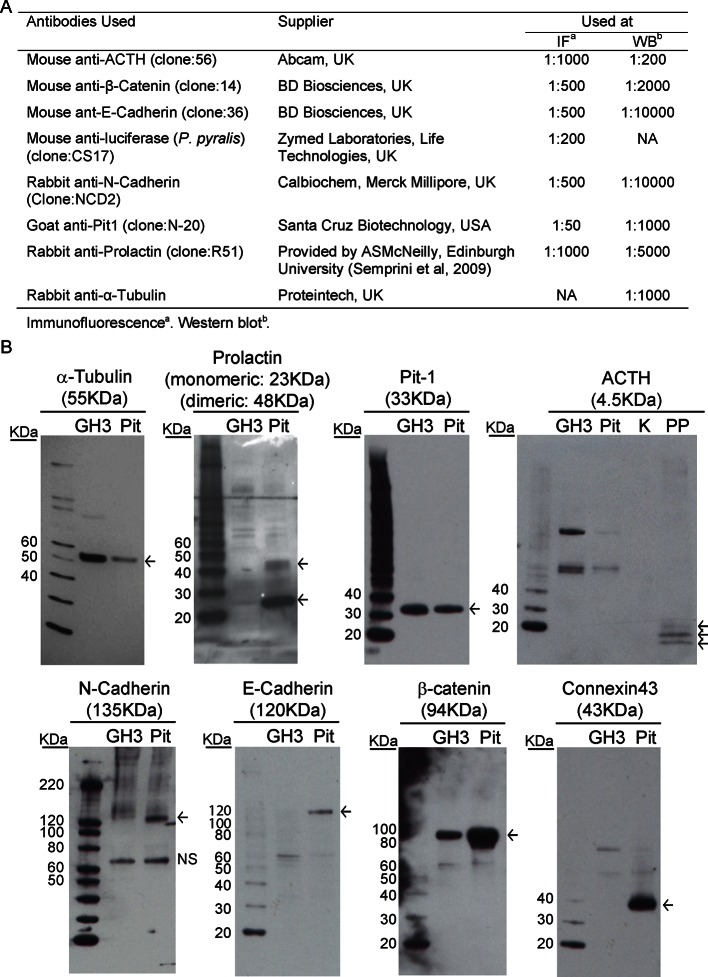
(A, B) Immunofluorescence analysis of lactotroph cell connectivity in developing pituitaries. (A) Immunofluorescence images show co-expression of luciferase antibody (green), used to identify lactotroph cells, with PRL, N-Cadherin, E-Cadherin, and β-catenin (red) in paraffin-embedded sections from P1.5 PRL-Luc49 rats. Nuclei were counterstained with DAPI (blue). Right: 8x crop images. Bars in images represent 50 µm. (B) Table showing the proportion of lactotroph cell clustering in E18.5 and P1.5 pituitary tissue and the level of co-expression of the luciferase protein and the protein of interest indicated, counted from immunofluorescence images. (C–K) Electron microscopy analysis of lactotroph cell connectivity in E18.5 (C-E) and P1.5 (F-K) pituitaries. (C, F) Representative image of two luciferase positive cells detected through immunogold labelling of luciferase antibody. Bars represent 1 µm. (D, G) Graph of the number of cells contacting an individual luciferase-positive cell. Undiff, undifferentiated cell. Luc, luciferase-expressing cell. FS, folliculostellate cell. PRL, lactotroph. GH, somatotroph. LH, gonadotroph. (E, H) Graph quantifying the different types of cell junctions present between luciferase-positive cells. Data in D-E and G-H are represented as mean + SEM. (I, J) Electron micrograph of a visually normal adherens junction (AdJ), a visually normal tight junction (TJ) and a visually normal gap junction (GJ) in P1.5 pituitaries. Bars represent 200 nm. (K) Electron micrograph of an abnormal adherens junction in P1.5 pituitary. Bar represents 200 nm. Information and validation of antibodies used are presented in Figure 5—figure supplement 1. SEM, standard error of the mean.


