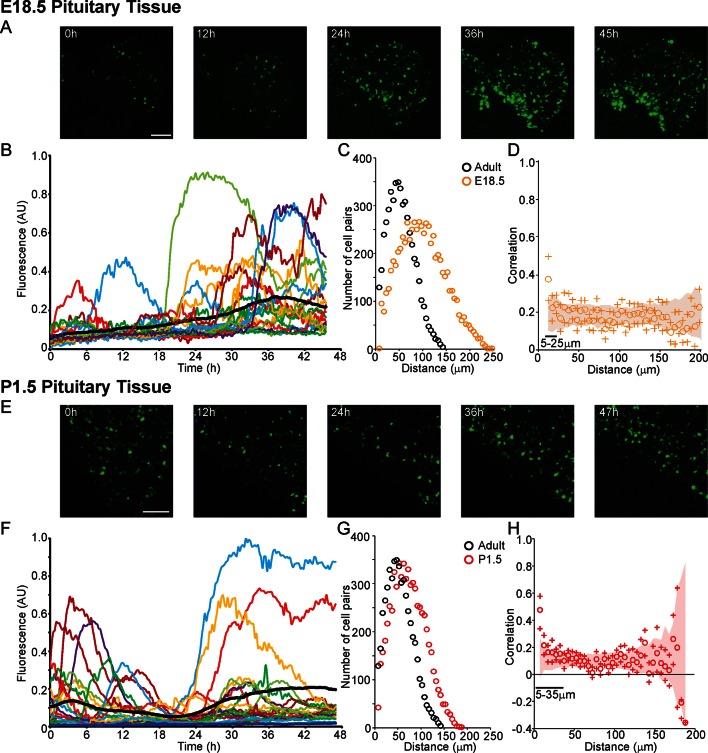
Figure 6. Patterns and spatial organisation of prolactin gene transcription activity in immature pituitary tissue.
(A, B) Activity of the hPRL-d2EGFP reporter construct in single cells in E18.5 pituitary tissue over 46 hr. (A) Images of d2EGFP expression in lactotroph cells in E18.5-day-old pituitary tissue (male). (B) Fluorescence profiles from 20 individual cells, representative of 136 cells analysed (average intensity, arbitrary units). The black line represents the mean average activity from all the cells analysed (136 cells), the dark blue line represents the background fluorescence intensity (mean from five areas). (C, D) Spatial correlation between fluorescence profiles of PRL transcription activity is reduced in E18.5 pituitary tissue in comparison to adult tissue. (C) The distribution of cell pairs in E18.5 tissue is compared to the adult cellular distribution. (D) Correlation vs distance plots show no large differences between randomised and non-randomised data over short cell-to-cell distances. (E, F) Activity of the hPRL-d2EGFP reporter construct in single cells in P1.5 pituitary tissue over 46 hr. (E) Images of d2EGFP expression in lactotroph cells in P1.5-day-old pituitary tissue (female). (F) Fluorescence profiles from 20 individual cells, representative of 115 cells analysed. Lines are coloured as in (A) with the mean representing the activity from all cells analysed. (G, H) Spatial correlation between fluorescence profiles of PRL transcription activity was reduced in P1.5 pituitary tissue in comparison to adult tissue. (G) The distribution of cell pairs in P1.5 tissue is compared to the adult cellular distribution. (H) Correlation vs distance plots show no large differences between randomised and non-randomised data over short cell-to-cell distances. Correlation vs distance plots are shown as described in Figure 3B. Images shown are maximum intensity projections of zstacks (E18.5: 165 µm; P1.5: 196 µm). Bar in images represents 100 µm. E18.5 (181 cells) and P1.5 (217 cells) data shown were taken from two independent representative experiments. hPRL, human prolactin.
Figure 6—figure supplement 1. Autocorrelation analysis of fluorescence profiles from developing pituitary tissue.
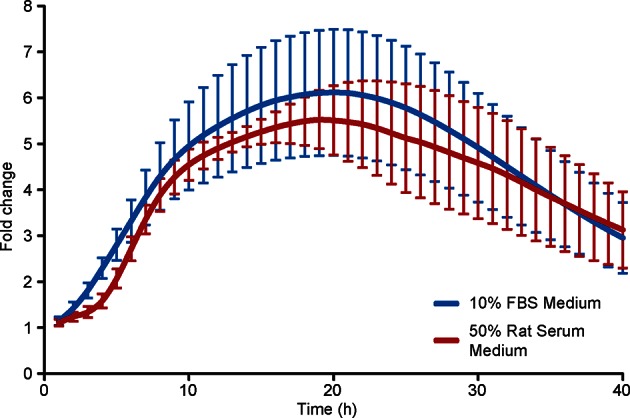
Figure 6—figure supplement 2. Comparison of prolactin transcription activity in adult pituitary tissue in different medium.


