. 2015 Dec 9;4:e07624. doi: 10.7554/eLife.07624

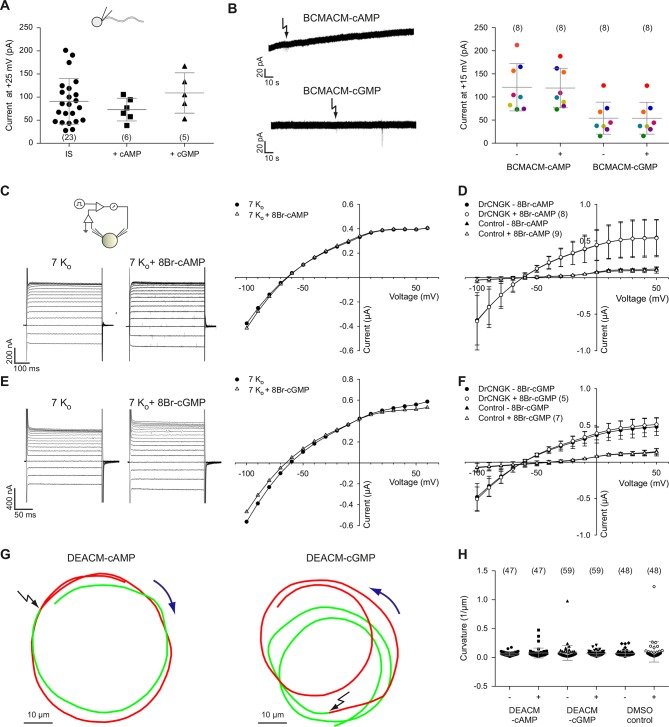
Figure 3. Cyclic nucleotides do not activate K+ channels in sperm.

(A) Current amplitude of whole-cell recordings from zebrafish sperm at +25 mV in the absence or presence of 100 µM cAMP or cGMP in the pipette (control: 91 ± 49 pA (n = 23); cAMP: 73 ± 25 pA (n = 6); cGMP: 109 ± 44 pA (n = 5)). Individual data (symbols) and mean ± sd (gray bars), number of experiments in parentheses. (B) Photo-release of cyclic nucleotides from caged precursors inside sperm. Left panel: Whole-cell recordings at +15 mV from sperm loaded with 100 µM BCMACM-caged cAMP (upper panel) or BCMACM-caged cGMP (lower panel). Arrows indicate the delivery of the UV flash to release cyclic nucleotides by photolysis. Right panel: Mean current 3 s before (-) and 3 s after (+) the release of cAMP or cGMP. Statistics as in part A. Data points from individual sperm are indicated by identical colours. (C-F) Currents of heterologously expressed DrCNGK channels in the absence or presence of 8Br- analogs of cyclic nucleotides. (C) Left: Two-Electrode Voltage-Clamp recordings from DrCNGK-injected Xenopus oocytes. Currents shown are in the absence (left traces) and presence (right traces) of 10 mM 8Br-cAMP. Voltage steps as shown in Figure 3—figure supplement 1A. Right: IV relations of current recordings from the left panel. (D) Pooled IV curves from DrCNGK injected and control oocytes; recordings in the absence and presence of 10 mM 8Br-cAMP. (E) Left: Two-Electrode Voltage-Clamp recordings from DrCNGK injected Xenopus oocytes. Currents shown are in the absence (left traces) and presence (right traces) of 10 mM 8Br-cGMP. Right: IV relations of current recordings from the left panel. (F) Pooled IV curves from DrCNGK-injected and control oocytes; recordings in the absence and presence of 10 mM 8Br-cGMP. (G) Swimming path before (green line) and after (red line) photo-release (black flash) of cAMP (left panel) or cGMP (right panel). The blue arrow indicates the swimming direction. Photo-release of cyclic nucleotides was verified by monitoring the increase of fluorescence of the caging group (Figure 3—figure supplement 5) (Hagen et al., 2003). (H) Path curvature before (-) and after (+) release of cAMP or cGMP. Sperm were loaded with 30 µM DEACM-caged cAMP or DEACM-caged cGMP. Statistics as in part A.

DOI: http://dx.doi.org/10.7554/eLife.07624.010

Figure 3.

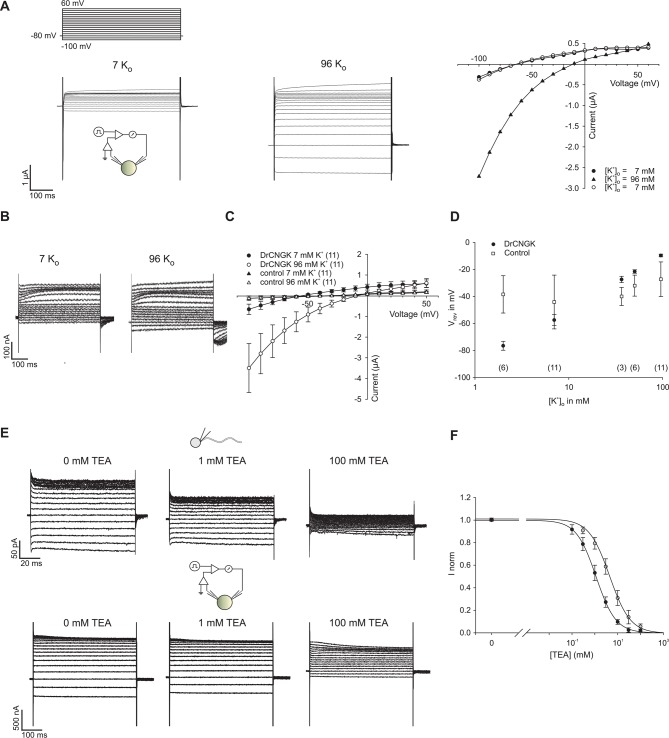
Figure 3—figure supplement 1. K+ dependence of heterologously expressed DrCNGK channels in oocytes and channel block by tetraethylammonium (TEA).

Figure 3—figure supplement 1.

(A) Two-Electrode Voltage-Clamp recordings of heterologously expressed DrCNGK channels in the presence of different K+ concentrations (left panel: 7 mM, middle panel: 96 mM) and corresponding IV relation (right panel). (B) Two-Electrode Voltage-Clamp recordings of uninjected oocytes (control) in the presence of different K+ concentrations (left panel: 7 mM, middle panel: 96 mM). (C) Pooled IV curves of Two-Electrode Voltage-Clamp recordings of DrCNGK-injected and uninjected oocytes (control) in the presence of different K+ concentrations (left panel: 7 mM, middle panel: 96 mM). Number of experiments is given in parentheses. (D) Reversal potentials (Vrev) of DrCNGK-injected and control oocytes in the presence of different K+ concentrations. Number of experiments is given in parentheses. (E) Whole-cell recordings from zebrafish sperm and Two-Electrode Voltage-Clamp recordings from heterologously expressed DrCNGK channels in the absence and presence of different TEA concentrations (0, 1, and 100 mM TEA). (F) Normalized ((I-IminFit)/ImaxFit) dose dependence of TEA block. Mean current ± sd. Individual dose response curves were fitted with the Hill equation. Mean ( ± sd) Ki value and Hill coefficient for sperm K+ current were 4.5 ± 1.1 mM and 1.0 ± 0.2 (n = 5) and for DrCNGK in oocytes 1.6 ± 0.3 mM and 1.0 ± 0.1 (n = 11), respectively. The solid lines were calculated with the Hill equation using mean values for Ki and the Hill coefficient.
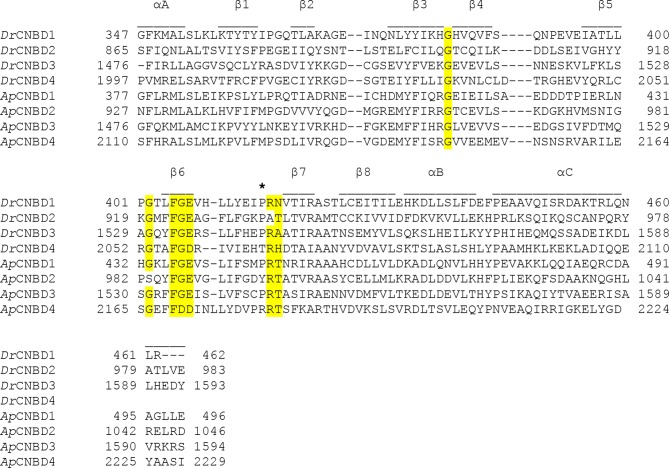
Figure 3—figure supplement 2. Sequence alignment of the individual CNBDs from the DrCNGK and ApCNGK channels.

Figure 3—figure supplement 2.

The secondary structure elements of CNBDs are indicated above the sequences. A key Arg residue between β6 and β7 is indicated by an asterisk. An FGE motif important for interaction with cyclic nucleotides and highly conserved Gly residues that are important for the CNBD fold are highlighted in yellow.
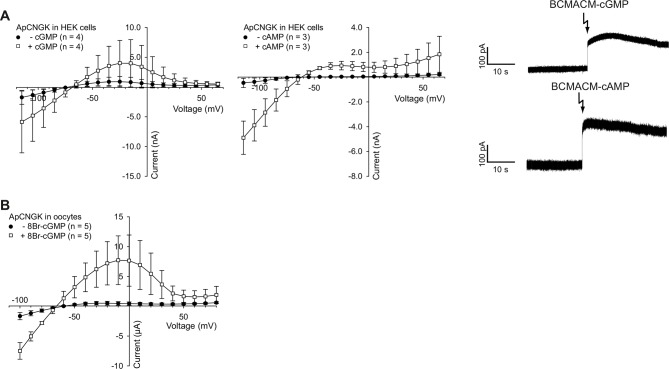
Figure 3—figure supplement 3. Photo-release of cyclic nucleotides in HEK cells expressing ApCNGK channels and use of 8Br-analogs in ApCNGK-injected oocytes.

Figure 3—figure supplement 3.

(A) Left and middle panel: Pooled IV curves of ApCNGK channels heterologously expressed in HEK cells before (-cGMP or -cAMP) and after the release of cGMP or cAMP. Cells were loaded with 100 µM BCMACM-GMP or BCMACM-cAMP. Right panel: Whole-cell recordings at +15 mV from HEK cells heterologously expressing ApCNGK channels loaded with 100 µM BCMACM-caged cGMP (upper panel) or BCMACM-caged cAMP (lower panel). Arrows indicate the delivery of the UV flash to release cyclic nucleotides by photolysis. (B) Pooled IV curves of Two-Electrode Voltage-Clamp recordings of ApCNGK-injected oocytes in the presence and absence of 3 mM 8Br-cGMP.
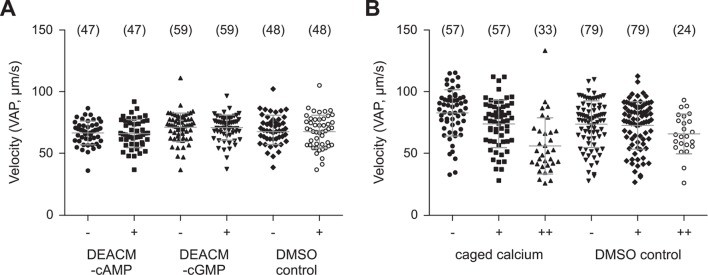
Figure 3—figure supplement 4. Photo-release of cyclic nucleotides (A) or Ca2+ (B) in sperm.

Figure 3—figure supplement 4.

(A) Mean velocity (averaged-path velocity, VAP) before (-) and after (+) release of cAMP or cGMP. Sperm were loaded with 30 µM DEACM-caged cAMP or DEACM-caged cGMP. Individual data (symbols) and mean ± sd (gray bars), number of experiments in parentheses. (B) Mean velocity (VAP) before and after the 1st (+) and 2nd (++) UV flash. Statistics as in part A.
Figure 3—figure supplement 5. Control of loading and release of DEACM-cAMP in zebrafish sperm.

Figure 3—figure supplement 5.

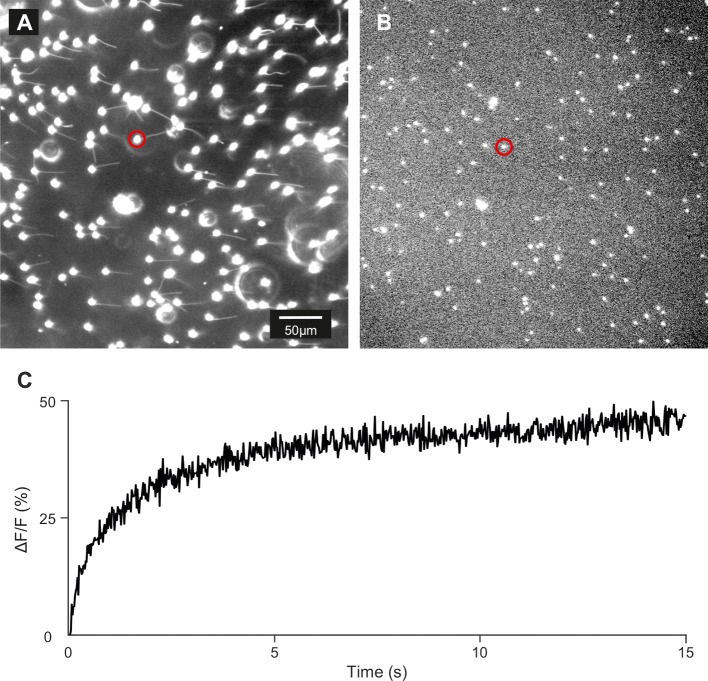
(A) Dark-field micrograph (using red light) of sperm loaded with DEACM-caged cAMP (30 µM). (B) Fluorescence image after 15 s of continuous illumination with 365 nm UV light (1.75 mW power). (C) Time course of the release for the cell marked with a red circle.