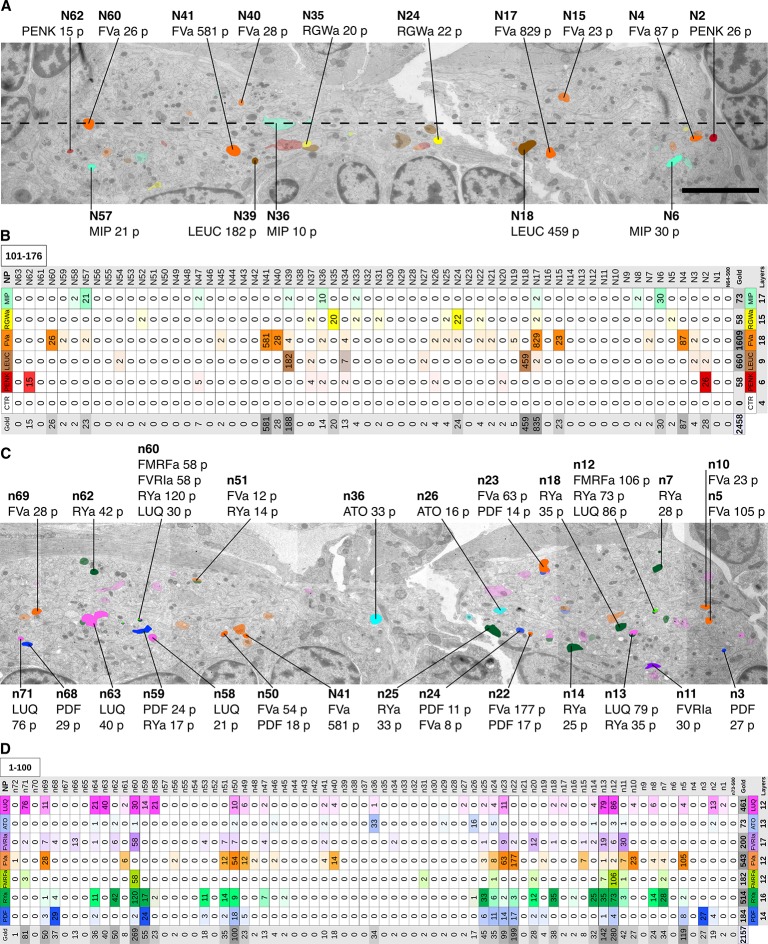
Figure 3. Identification of peptidergic neurites by siGOLD in a 72 hpf Platynereis specimen (HT9-5).
(A, C) Anterior view of EM cross-section through the VNC near the first commissure. Dorsal side of larva is to the top. Strongly labeled neurites were analyzed across the whole VNC region. Control axon profiles were analyzed along a transect (dotted line), two axon profiles were sampled every 1 μm. Total of 72 and 63 axons were examined for the first and second series of sections respectively (an approximately 10-section gap occurs between the two series). Colored cell profiles indicate gold labeled neuropeptidergic axons. Different shades of a color represent an approximation of labeling intensity. Positive axons are tagged with neuron number, neuropeptide name, and total number of gold particles per total number of layers for that neuropeptide. (B, D) Tables show number of gold particles per axon for each neuropeptide. All strongly labeled axons across the VNC and control axons along the sampled transect are shown. Data were arranged according to the spatial distribution of the corresponding neurites in the VNC. Each sampled axon was traced across all layers and counted for its total number of gold particles. Columns indicate neurons and an ID with ‘n’ is given to each neuron in the first series of sections and ‘N’ for neurons in the second series of sections. Rows indicate neuropeptide immunogold labels. Different shades of the same color indicate intensity of gold labeling. Totals are shown for each row (neuropeptide) and each column (axon profile). In the final column of each table, the total number of layers stained for each neuropeptide is shown. Scale bar: 5 μm. Gold scores are available in Figure 3—source data 1.
DOI: http://dx.doi.org/10.7554/eLife.11147.006


