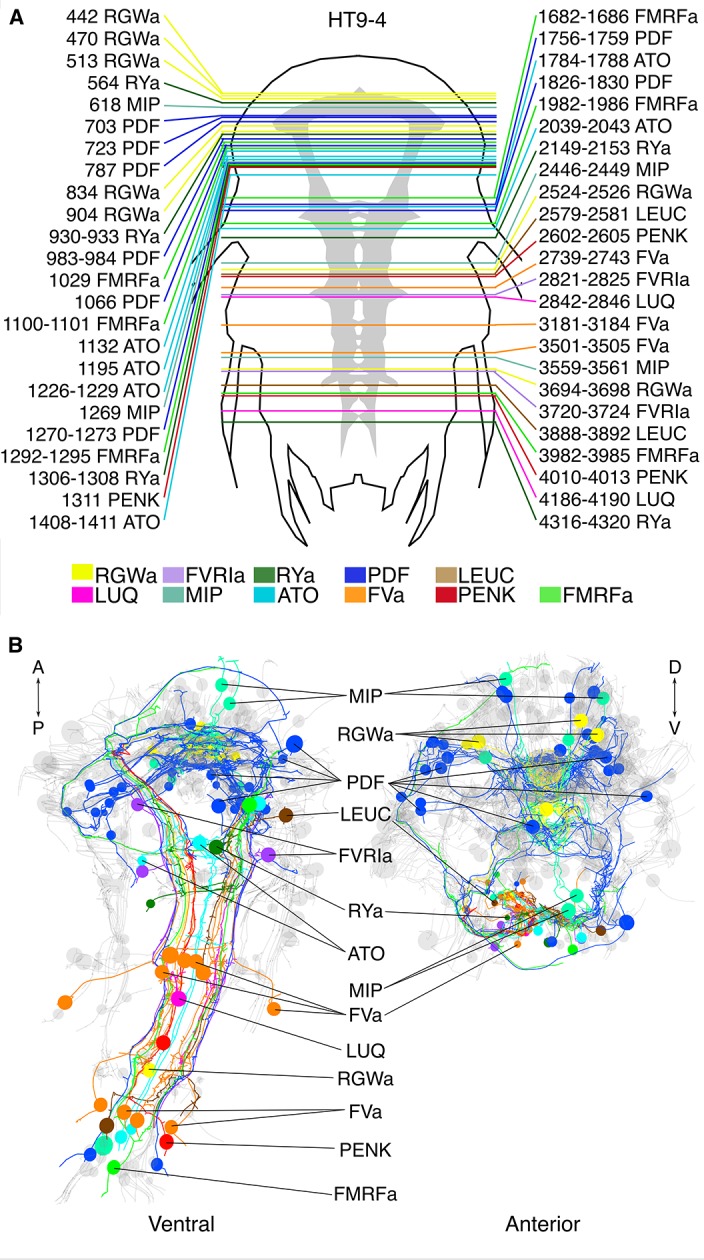
Figure 6. siGOLD labeling in a whole-body serial EM dataset (HT9-4).

(A) Schematic of the HT9-4 specimen showing the position of the VNC (grey), ventral view. The entire larva was fully sectioned and imaged. Colored lines indicate the position of sections that were used for immunolabeling. For each line, layer number(s) followed by the name of the neuropeptide that was immunogold-labeled in those layers are indicated. (B) Ventral and anterior views of all fully traced immunogold-labeled peptidergic neurons. Detailed layer information is available in Figure 6—source data 1.
DOI: http://dx.doi.org/10.7554/eLife.11147.014
