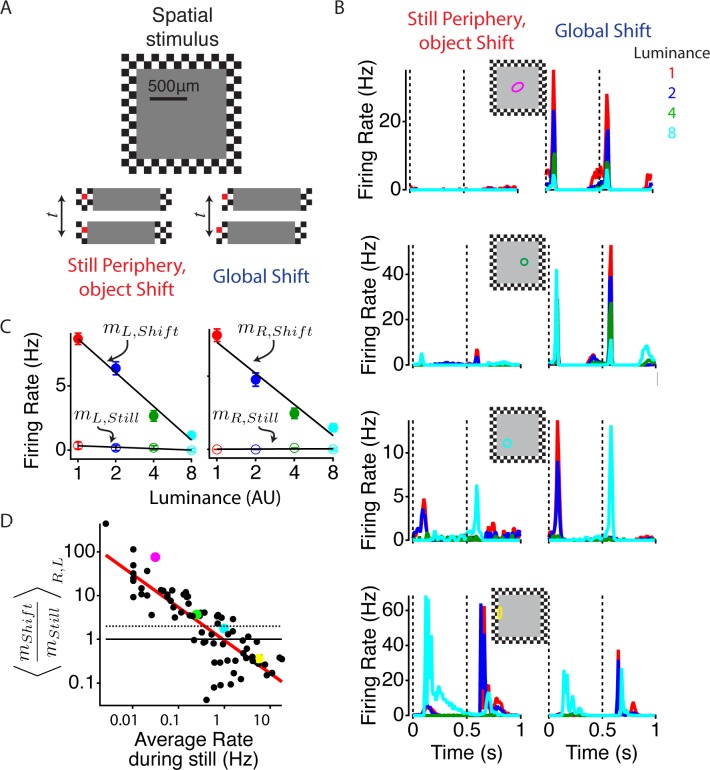
Figure 1. Global image shifts increase sensitivity to weak local input.
(A) (Top) A diagram of the stimulus is shown. The central square representing an object shifted left or right either in the presence of a static periphery (still periphery, moving object, left in bottom panel) or in conjunction with the periphery (global shift, right in bottom panel). In both conditions, the central stimulation was the same. Shifts occurred every 0.5 s, and the luminance level in the object changed every 110 s to one of four values spaced logarithmically. Lower panel shows the central stimulus region under both peripheral conditions. One checker is colored red (not used in actual stimulus) to help the reader identify the relationship between this particular checker and the central stimulus. (B) Average firing rate response of four different cells from different preparations to four different luminance values under both peripheral conditions: object shift (left), global shift (right). Stimulus shifts to the right (0 s) and left (0.5 s) are marked with dotted lines. The classical (linear) receptive field center, computed from a white noise checkerboard stimulus is shown as a colored oval. (C) Average firing rate computed between 50 and 150 ms after the stimulus shifted to the left and right for the cell shown in (B, top panel), colors of dots show different luminance levels corresponding to the curves in (B). A linear fit (lines) to the data was used to compute the sensitivity m to the luminance of the central region, computed as the slope of the firing rate vs. the log of the central luminance for left and right object shifts with periphery still (open circles, , ) and for global shifts (filled circles, ). (D) The ratio of the luminance sensitivity m during global and object shifts compared for each cell to the firing rate in the object shift condition, indicating the strength of the object shift stimulus. Axes are logarithmic. Results for and were averaged over shifts to the left and right. Cells above the dotted line increased the slope of firing vs. central luminance by more than a factor of two during a global shift compared with an object shift. Colored dots correspond to the cells shown in (B).

