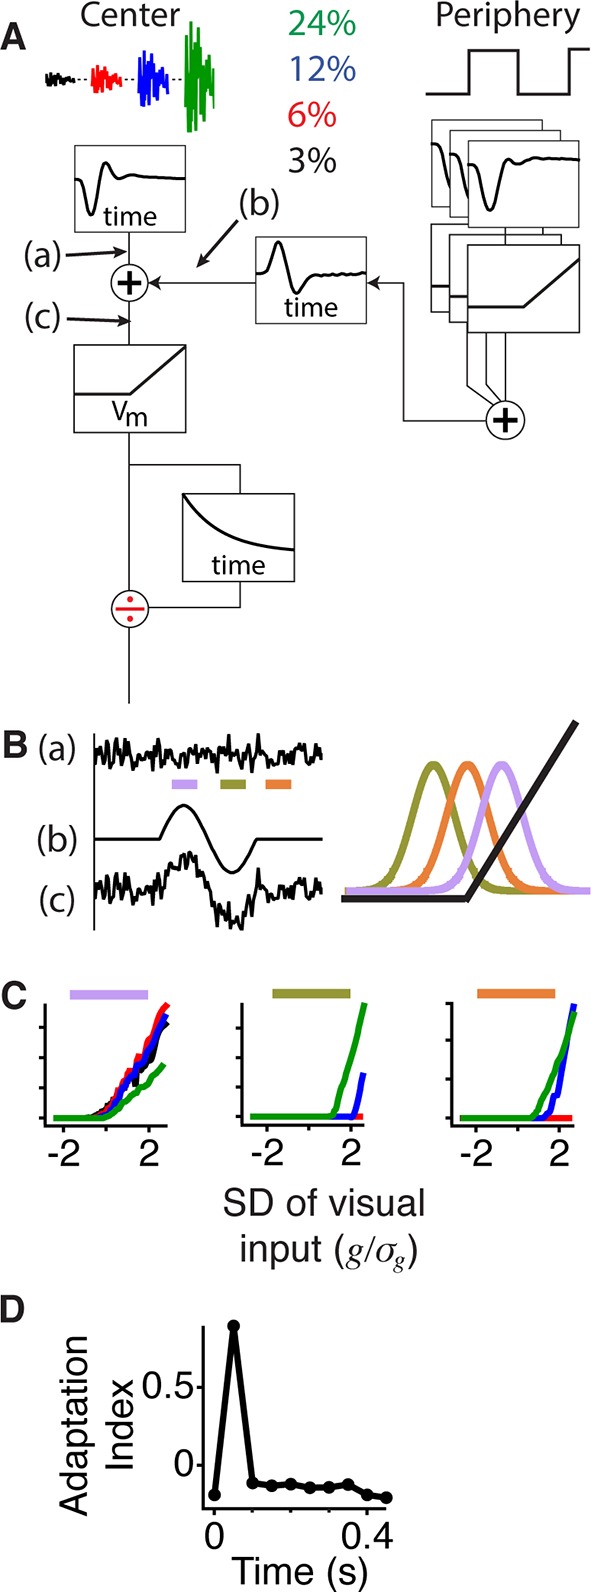
Figure 5. Gating of information through a shift in an internal threshold.
(A) Model of a cell where two pathways are combined prior to a threshold and an adaptive block, implemented here as a feed forward divisive effect with a memory. Peripheral pathway is composed of many nonlinear subunits making the pathway insensitive to the stimulus spatial pattern and delivers biphasic input to the central pathway (first positive, then negative). The stimulus is Gaussian white noise at 3–24% contrast matching the experiment (and colors) in Figure 3. The central pathway is composed of a linear temporal filter, because stimulus is only a function of time. (B) Signals arising at points (a), (b) and (c) whose locations in the model are marked in panel (A). When the peripheral input is positive (gating window, purple bar) or negative (suppression window, olive green bar) the central input is shifted to higher or lower values with respect to the baseline state (recovery window, orange bar) and fixed threshold. Right, the Gaussian distribution of the filtered stimulus occurring at point (c) in (A) compared to the threshold nonlinearity occurring after point (c) in (A) during the gating (purple), suppression (olive green) and recovery (orange) windows. The peripheral input effectively shifts the Gaussian mean with respect to the fixed threshold. (C) Model responses to the same Gaussian stimulus used in Figure 3 at the times of the corresponding color bars in (B). (D) Adaptation index for the model’s output as a function of time after the shift.


