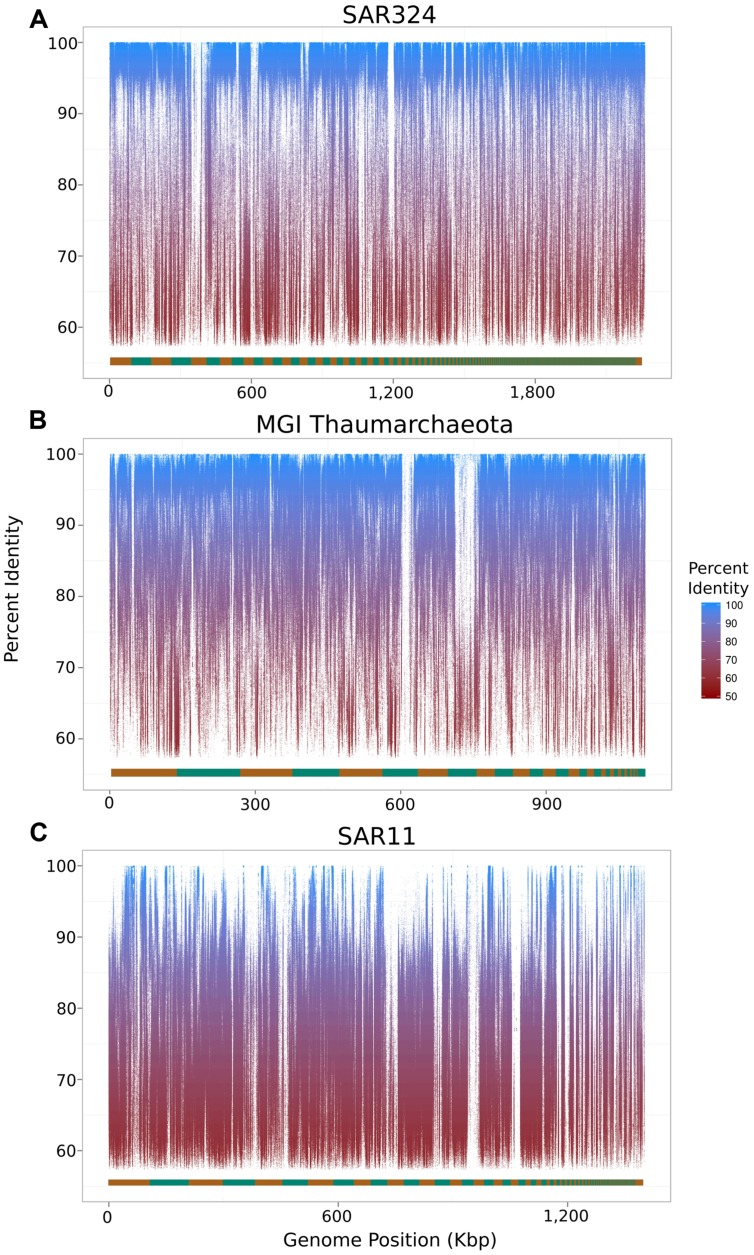
FIGURE 2.
Fragment recruitment plots of metagenomic reads mapped onto the original SAR324 clade bacterioplankton (A), MGI Thaumarchaeota (B), and SAR11 clade bacterioplankton (C) SAGs analyzed in this study. The alternating orange and green bar at the bottom of each plot shows the contig boundaries, which are ordered from longest to shortest.

