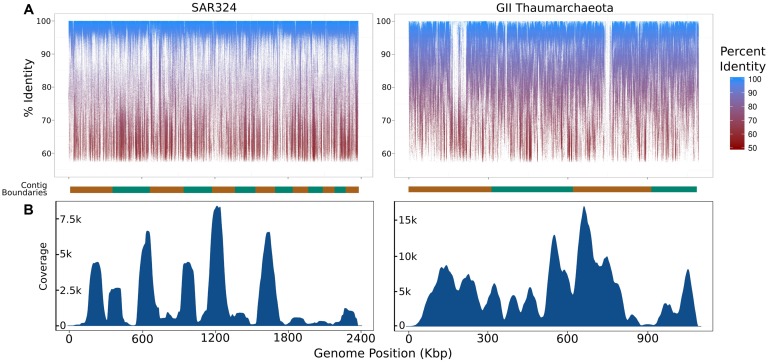
FIGURE 3.
Summary of coverage of the iSAGs assembled here in the metagenomic and single-cell datasets used. (A) Fragment recruitment plots of metagenomic reads mapped onto the iSAGs constructed in this study. The alternating orange and green bar at the bottom of each plot shows the contig boundaries, which are ordered from longest to shortest. (B) Density plots showing the relative coverage of the raw SAG reads mapped onto the iSAGs constructed here.

