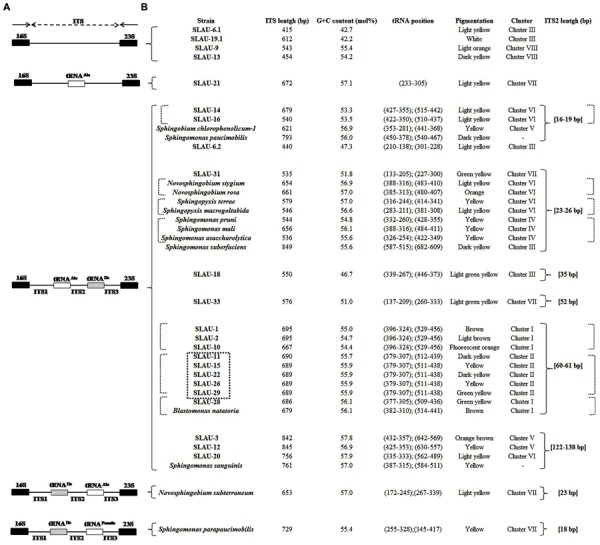
FIGURE 2.

(A) Map showing different patterns observed in the 16S–23S rRNA ITS based on the tRNA (Ala and Ile) genes present. (B) The size of the different ITS was not respected. Table showing the length, G/C content, tRNA position, pigmentation, cluster based on the phylogenetic tree, and ITS-2 size of the isolates and reference strains included in this study. The position of each of the tRNAs is indicated in brackets, respectively. The dotted square indicates isolates having exactly identical ITS sequences. The dotted brackets indicate isolates having identical or similar ITS-2 sequences.
