
Figure 2.
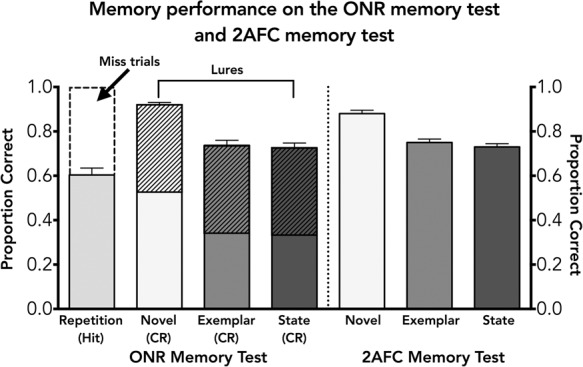
Memory performance on the ONR memory test (left) and 2AFC memory test (right) that were given after the study phase. The dashed box above the “Repetition” bar indicates the proportion of miss trials. The raw correct rejection score is equal to the total bar height for each of the lure conditions. The lure discrimination index (Yassa et al. 2011) accounts for response bias by subtracting the number of “new” responses attributed to misses from each of the lure conditions. This proportion is shown in the hashed portion on the top of each lure condition (novel, exemplar, and state).