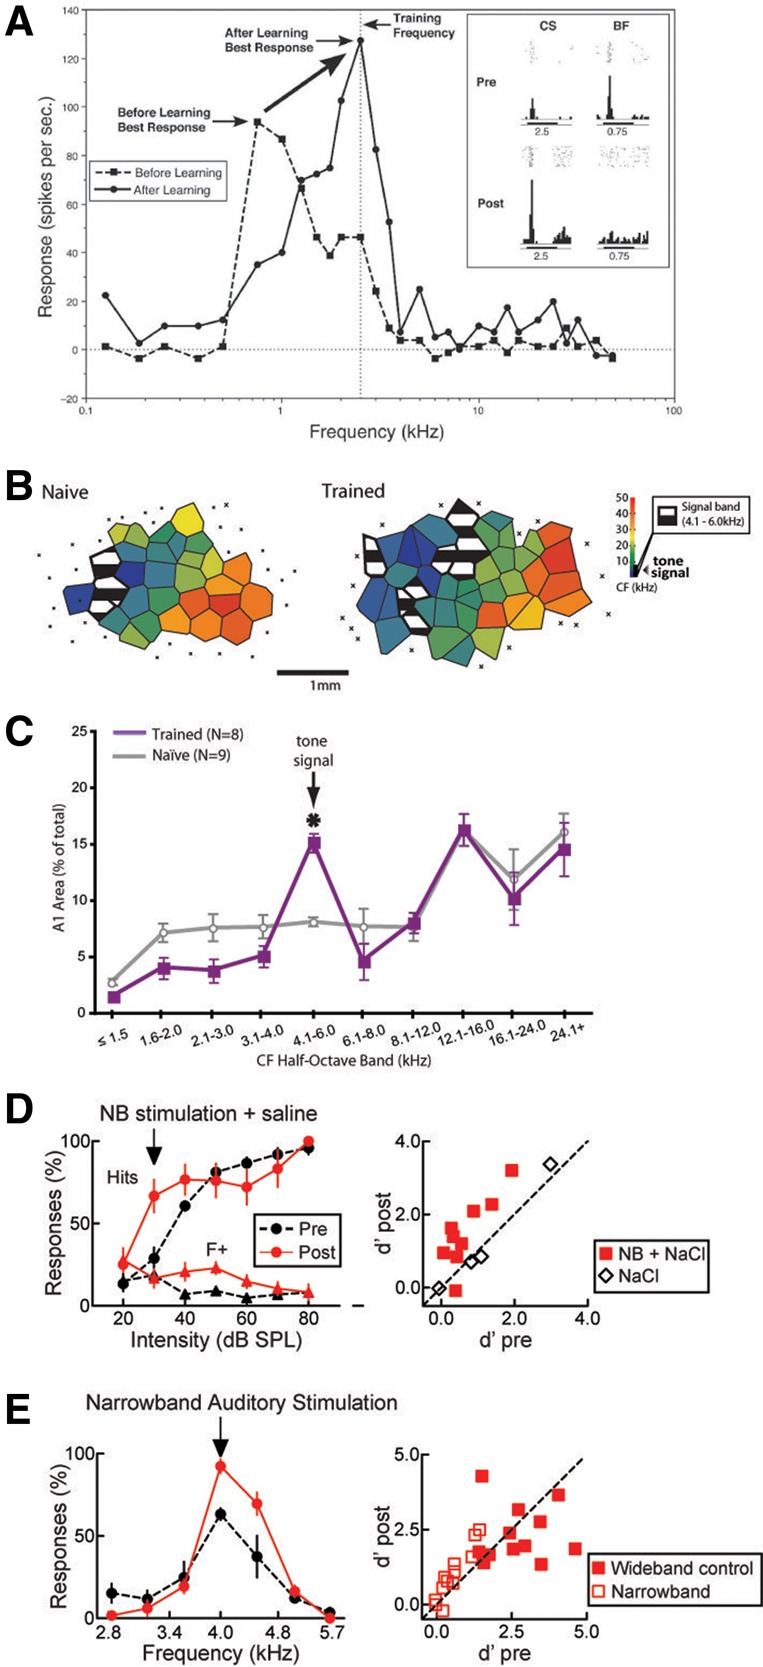
Figure 1.

Learning-induced auditory plasticity. (A) Learning-induced change in the preferred frequency of an A1 cortical neuron toward the frequency of the reinforced stimulus. Prior to conditioning, the frequency–response curve of this neuron peaked at ∼750 Hz (dashed line), but shifted to 2.5 kHz after conditioning with a 2.5-kHz tone (the CS) paired with shock. The inset shows peristimulus spike histograms for this neuron for the CS frequency and its original 750-Hz best frequency (BF) before and after conditioning. Note the clear change in frequency preference. (Adapted from Weinberger 2007.) (B) Pseudocolored maps showing the electrophysiologically determined frequency preference (characteristic frequency, or CF) for different patches of primary auditory cortex in an experimentally naïve rat (left) versus a rat that had been trained to bar press for reward during presentation of a 5 kHz tone (right). Black and white hatching denotes the regions preferring the frequency band including the training tone. (C) Distribution of cortical area on average across animals as a function of characteristic frequency bands in naïve and trained rats from B. (B,C are adapted from Bieszczad and Weinberger 2010b and used with permission from PNAS.) (D) Changes in behavioral responses on a psychophysical detection task that indicate improved detection of a 4-kHz target stimulus at low stimulus intensities following pairing of the target stimulus with nucleus basalis (NB) stimulation. This is reflected in an increase in Hit rate at low stimulus intensities (left) and an improved d′ value (right). (E) Changes in behavioral responses on a psychophysical discrimination task indicating improved discrimination of the CS following narrowband stimulus (left) but not a control wideband stimulus pairing with nucleus basalis stimulation. (D,E are adapted from Froemke et al. 2013 and used with permission from Nature Publishing Group 2013.)
