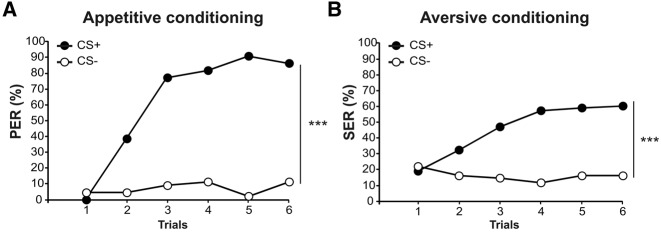
Figure 2.
Appetitive and aversive conditioning performances. Acquisition curves are shown for bees trained in (A) an appetitive or (B) an aversive differential conditioning protocol. The curves show the percentage of individuals eliciting a behavioral response (proboscis extension in A, sting extension in B) to the reinforced odorant (CS+) or the nonreinforced one (CS−) along the trials. All bees learned to discriminate the reinforced odorant from the nonreinforced one, both in appetitive and aversive conditioning ((***) P < 0.001; appetitive: N = 44; aversive: N = 68).

