Figure 3.
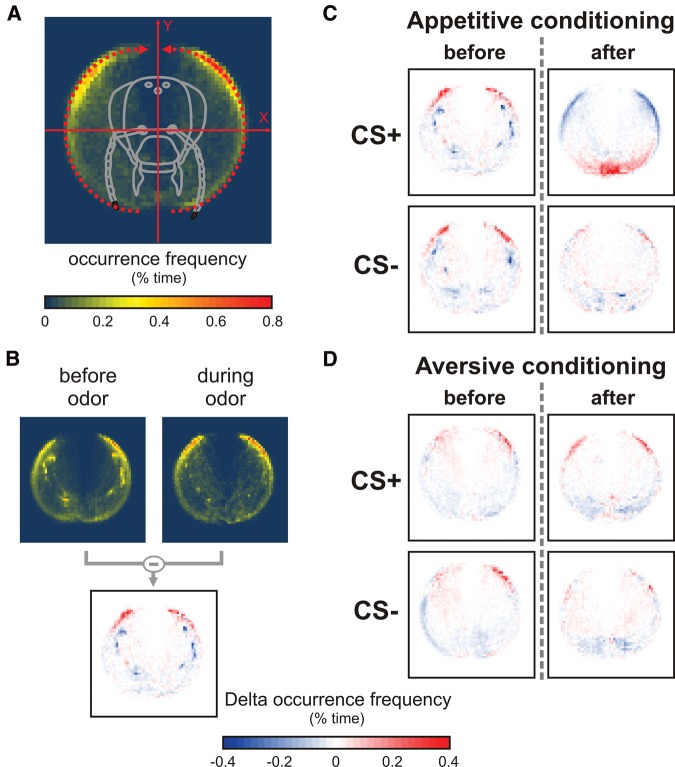
Heatmap of antennal tip occurrence before and after conditioning. (A) The space explored by bees’ antenna oscillations during odor presentation was calculated by counting the number of times each antennal tip was found at each location. The occurrence frequency at each location is expressed as a percentage of all the recorded occurrences, and displayed following a color scale from dark blue to red. (B) Maps of antenna location change are computed by subtracting the map obtained “before” from the map “during” odor. Such maps are color coded, with blue showing a reduction and red showing an increase in frequency, respectively. (C,D) Heatmaps showing the change in occurrence rate of antennal tips during CS+ and CS− presentation, either 1 h before or 1 h after C an appetitive (N = 44 bees) or D an aversive conditioning (N = 68 bees). The space explored during CS+ presentation after appetitive conditioning differed clearly from the one observed before conditioning, high occurrence areas being located mostly forward. Such a modification was not discernible for the CS−, and no clear change was observed for aversive conditioning.

