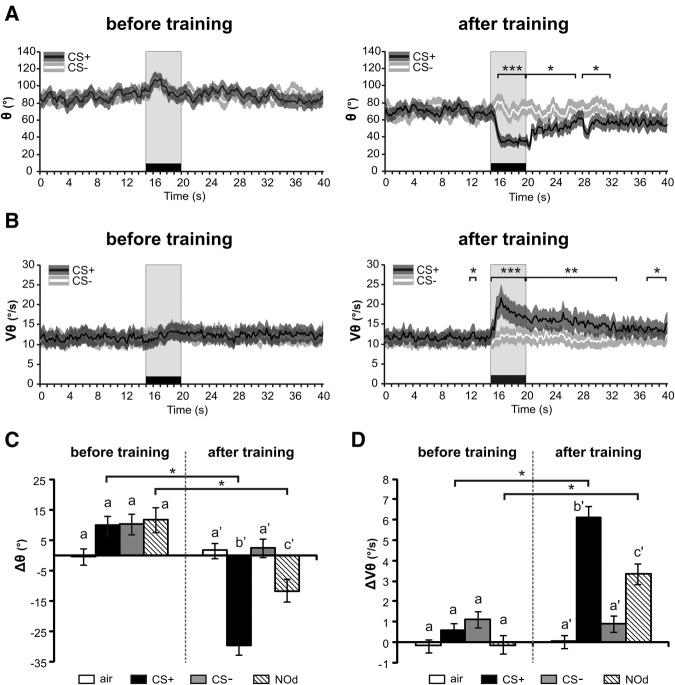
Figure 4.
Effect of appetitive conditioning on antennal responses to odors. (A,B) Temporal variation curves (averaged every 200 msec) before and after training for (A) antenna angular position (θ) and (B) angular velocity (Vθ). After training appetitive conditioning induced a forward motion of the antennae with an antenna acceleration. Stars indicate significant differences between CS+ and CS− in paired t-tests performed at every second of the recordings ((*) P < 0.05; (**) P < 0.01; (***) P < 0.001). (C,D) Histograms showing the change in (C) angular position (Δθ) or (D) angular velocity (ΔVθ) during odor presentation (during–before odor) for the air control (white), the CS+ (black), the CS− (light gray) and the novel odorant (NOd, stripes), before and after conditioning. Before conditioning, any olfactory stimulation led to a backward motion of the antennae, whereas after conditioning the CS+ but not the CS− induced a forward motion of the antennae (C, Δθ). Conditioning also induced an increase in antenna velocity for the CS+ but no for the CS− (D, ΔVθ). Both effects generalized to the novel odorant (NOd) but on a smaller scale. Stars and different letters in C and D indicate significant differences in paired t-tests including a threshold correction for multiple comparisons (P < αcorr1 = 0.0125, N = 44).

