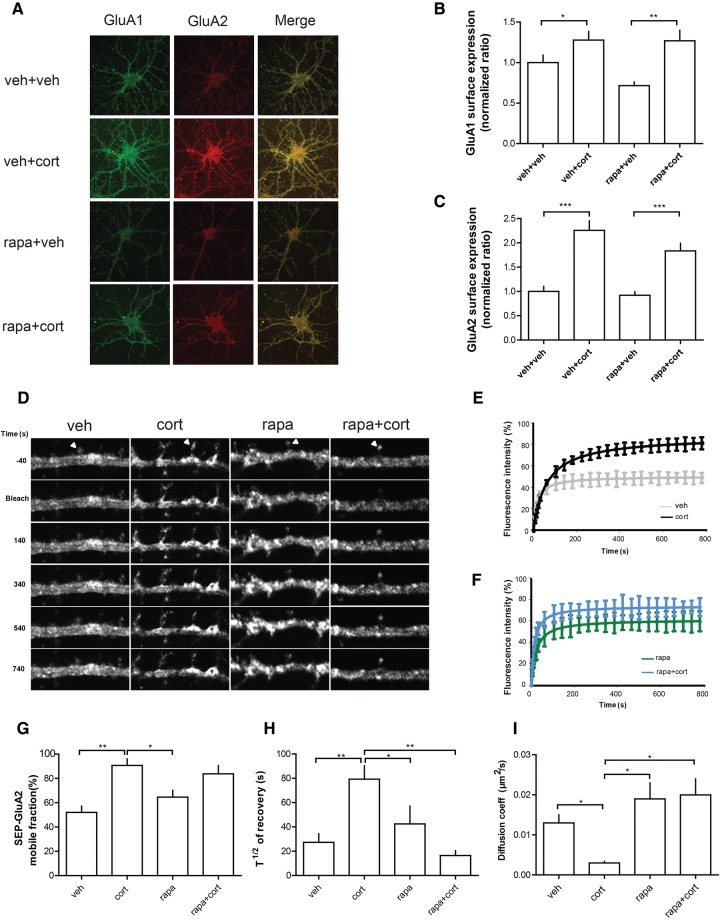
Figure 1.
mTOR signaling is involved in the regulation of plasma membrane AMPAR lateral diffusion of corticosterone-treated rat hippocampal neurons. (A) Representative images of rat hippocampal neurons with labeling of GluA1 (in green) and GluA2 (in red) AMPAR subunits after treatment with vehicle (veh), corticosterone (cort, 100 nM), rapamycin (rapa, 50 nM), and rapamycin + corticosterone (rapa + cort). (B,C) Histograms showing the mean (±SEM) quantification of surface GluA1 (B) or GluA2 (C) AMPAR subunits. Data are expressed as ratio of control (vehicle condition). (*) P < 0.05, (**) P < 0.01, (***) P < 0.001, one-way ANOVA, n > 10 cells in each group. (D) Sequential images from representative FRAP experiments performed on surface SEP-GluA2 from individual spine head (arrowheads) in control vehicle (veh) or in corticosterone (Cort, 100 nM) conditions, in the absence or presence of the potent mTOR inhibitor rapamycin (Rapa, 50 nM). (E) Normalized pooled and averaged FRAP curves from vehicle (n = 13 cells) and corticosterone (100 nM; n = 15 cells) treated hippocampal neurons. (F). Normalized pooled and averaged FRAP curves from rapamycin (50 nM; n = 13 cells) and rapamycin + corticosterone (Rapa, 50 nM, Cort, 100 nM; n = 16 cells) treated hippocampal neurons. (G–I). Histograms showing the means (±SEM) of synaptic SEP-GluA2 mobile fractions (G), the half time of fluorescence recovery (H), and the diffusion coefficient (I). One-way ANOVA was performed with a Bonferroni post-test for multiple comparison data sets. (*) P < 0.05, (**) P < 0.01.

