Figure 4.
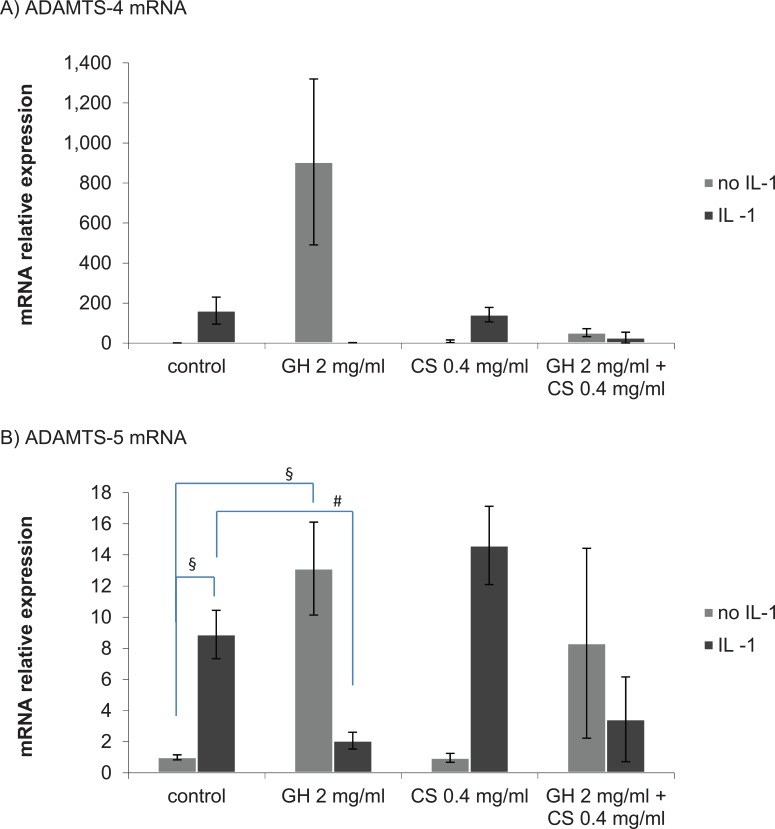
ADAMTS-4 mRNA expression (A) and ADAMTS-5 mRNA expression (B) at 24 hours post-stimulation with interleukin-1α (IL-1α), with chondroitin sulfate (CS) and glucosamine hydrochloride (GH) pretreatment. Values represent the mean fold change in expression relative to the control without IL-1α ± SEM, n = 3. One-sample Student t test. § indicates P < 0.05 for a comparison with the control without IL-1α stimulation. # indicates P < 0.05 for a comparison with the control with IL-1α stimulation.

