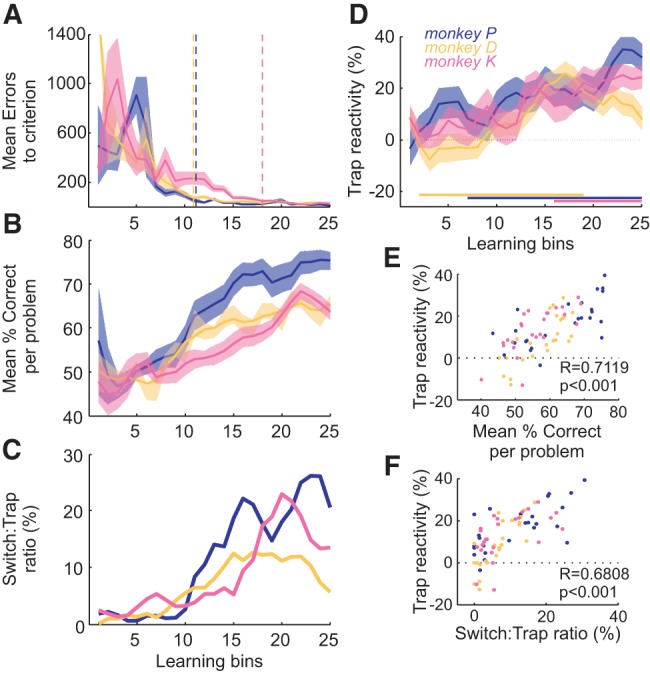
Figure 2.

Acquisition of the Identity task. (A) Mean errors to criterion across learning bins, showing significant learning. Vertical dotted lines indicate the stabilization point of the curve for each monkey (see Materials and Methods). Shaded area is standard error of the mean (sem). (B) The mean percentage of correct responses to criterion for problems of each learning bin. (C) The ratio of Switch over Trap trials (taken as an index of the volatility), for each learning bin. (D) The value of the Trap reactivity across learning bins. Trap reactivity is the difference in performance before and after the Trap trial. It increases from an initial value around zero, especially later in learning (horizontal bars). (E) Correlation between Trap reactivity and percentage correct. (F) Correlation between Trap reactivity and the switch:trap ratio. In all figures: monkey P, blue; monkey D, yellow; and monkey K, pink.
