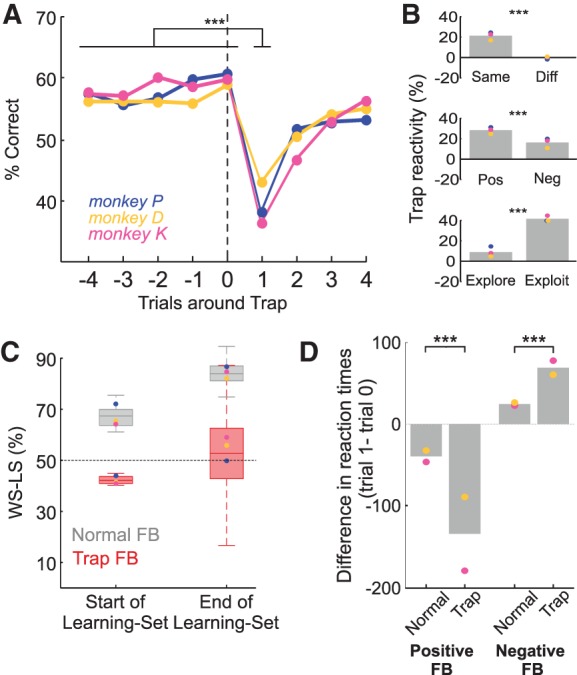
Figure 4.

Trap reactivity on IT. (A) Percentage correct around Trap trial (trial 0) for all monkeys. Trap reactivity is the drop of performance between trials 0 and 1. (B) (Top) Trap reactivity is modulated by the stimulus of the trial, specifically being present only when the subsequent trial is on the same stimulus as the Trap trial. (Middle) Trap reactivity is greater for “Positive” Traps (positive feedback after incorrect choice) than “Negative” Traps (negative feedback after correct choice). (Bottom) Trap reactivity is greater during exploitation compared to exploration period (See Experimental procedure). (C) Proportion of trials upon which Win-Stay Lose-Shift (WS-LS) strategy is applied after feedback in the Identity Task, split between normal and Trap feedback. Fifty percent represents a random (not WS-LS) strategy. Box plots represent group data, circles each monkey's mean. WS-LS is significant and increasing across learning for normal feedback, but absent for Trap feedback. (D) Effect of feedback on reaction times (RTs). Plot shows the difference (trial 1—trial 0) in RTs before and after the feedback in question. Full circles indicate a significant (P < 0.001) difference between trials 0 and 1 in every case. Feedback on trial 0 can be positive or negative, and that feedback can either be Trap feedback or “normal.” (Left panel) Post-correct speeding, which is further increased by Trap feedback. (Right panel) Post-error slowing, again increased by Trap feedback. In all figures, Monkey P, blue; monkey D, yellow; and monkey K, pink. Gray bars represent averages of all monkeys. Stars indicate the significant difference between conditions. (***) P < 0.001; (*) P < 0.05; ns: nonsignificant.
