Figure 3.

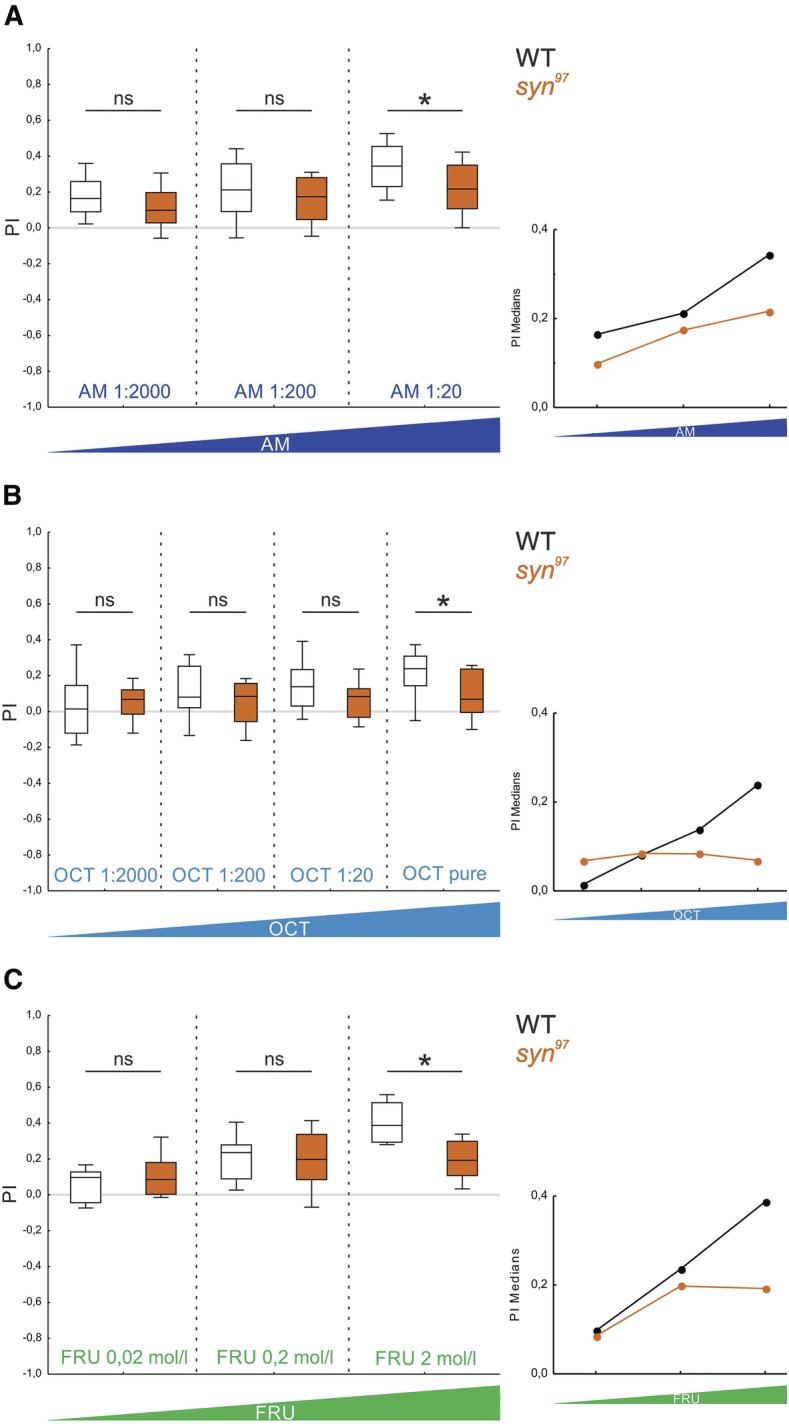
Odor–sugar memory in syn97 mutants is impaired selectively for high odor or sugar concentrations. (A) As higher concentrations of the odor AM were used (dark blue), defects in odor–sugar memory of the syn97 mutant strain become apparent (the inset shows the median PIs plotted across AM concentrations). White fill of the box plots is used for the wild-type WT strain, orange fill for the syn97 mutant strain. All displayed data were gathered in parallel. The underlying PREF scores are documented in Supplemental Figure S2. ns indicates P > 0.05/3, and (*) P < 0.05/3 in MWU tests. Other details as in Figure 2. (B) Same as in A, for OCT as odor. The underlying PREF scores are documented in Supplemental Figure S3. ns indicates P > 0.05/4, and (*) P < 0.05/4 in MWU tests (from left to right: U = 312, 293, 251, 277.5; N = 27, 27, 28, 28, 27, 27, 32, 32). Comparison within a given strain and across concentrations yields P < 0.05/2 at H = 16.16 for the wild-type WT strain and P > 0.05/2 at H = 1.10 for the syn97 mutant strain in KW tests (df = 3 in both cases). Other details as in Figure 2. (C) To examine whether the odor–sugar memory scores of the syn97 mutant are also dependent on the sugar concentration, three different fructose (FRU) concentrations were used. Only the highest fructose concentration (2 mol/L) revealed a syn97 mutant phenotype while for the other concentrations the memory scores of the wild-type WT and the mutant were at approximately the same level (the inset shows the median PIs plotted across fructose concentrations). All displayed data were gathered in parallel. The underlying PREF scores are documented in Supplemental Figure S4. ns indicates P > 0.05/3, and (*) P < 0.05/3 in MWU tests. Other details as in Figure 2. Regarding the wild-type WT, these results are qualitatively in line with Mishra et al. (2013) concerning odor concentration as well as with Neuser et al. (2005) and Schipanski et al. (2008) concerning sugar concentration, despite some variations in wild-type genotype and paradigm.
