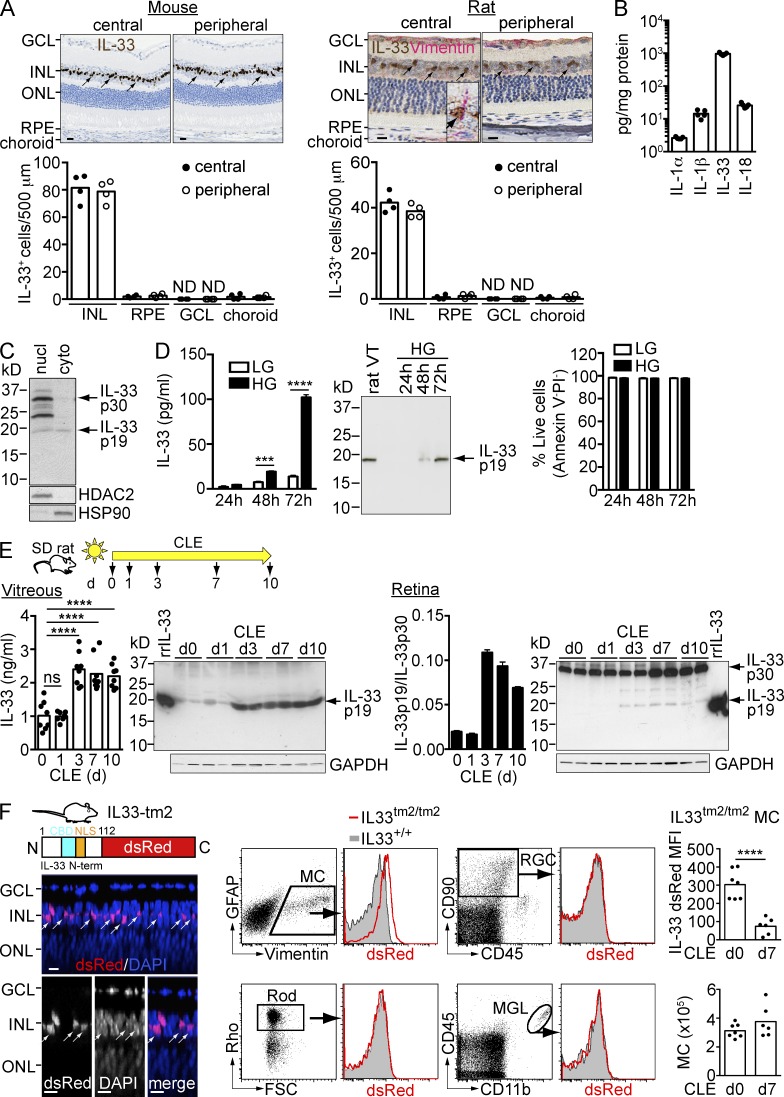
Figure 3.
IL-33 C terminus is released from Müller cells in vitro and in vivo after phototoxic stress. (A) Immunohistochemical staining of IL-33 (brown) in BALB/c mouse and Sprague-Dawley (SD) rat retina. The rat retina was co-stained with vimentin (red). Arrows, IL-33+ Müller cells. (inset) An IL-33+ vimentin+ Müller cell. IL-33+ cells in the INL, RPE, GCL, and choroid in the central and peripheral retina were counted along a ∼500-µm section. Bars, 10 µm. ND, not detected. (B) Expression of IL-1 family genes (IL-1α, IL-1β, IL-33, and IL-18) in the retina of BALB/c mice was measured by ELISA. Each data point represents an individual mouse (n = 5). (C) Western blotting of IL-33 expression in the nuclear (nucl) and cytoplasmic (cyto) fraction of rMC-1 cells. (D) ELISA and Western blotting analysis of IL-33 secretion from rMC-1 cells cultured in high-glucose (HG) and low-glucose (LG) containing medium. rat VT, rat vitreous. Cell viability was assessed by FACS analysis of Annexin V and PI staining. Live cells were gated as Annexin V− PI−. Data shown are means ± SEM of triplicate wells. (E) Expression and secretion of IL-33 p19 in rat vitreous and retina after CLE. SD rats were exposed to bright light for up to 10 d. IL-33 expression in the vitreous and retina was analyzed by ELISA and Western blotting. The ratio of IL-33 p19 versus IL-33 p30 in the retina was quantitated with Image J software. A recombinant rat IL-33 protein (rrIL-33; aa 109–264, ∼18 kD) was used as the positive control for the detection Ab. Each data point in ELISA represents an individual mouse (n = 8/time point). (F) IL33tm2/tm2 mice with intact IL-33 nuclear localization sequence (NLS) and chromatin-binding domain (CBD), but with the IL-33 cytokine domain replaced by dsRed show localization of IL-33 N-term-dsRed in nuclei of Müller cells in the INL. Images shown are Z-section views of confocal images of an IL33tm2/tm2 retina flat-mount. Arrows, IL-33+ Müller cells. Bars, 5 µm. Flow cytometry analysis of IL33tm2/tm2 retina with expression of IL-33 in Müller cells (MC) but not in rods, ganglion cells (RGC), or microglia (MGL). dsRED mean fluorescent intensity (MFI) of IL33tm2/tm2 Müller cells, as well as Müller cell numbers at d0 and d7 of CLE, were measured by flow cytometry. Data represent the MFI of dsRed in IL33tm2/tm2 mice normalized to that of IL33+/+ mice. Each data point represents an individual mouse (n = 6–7/group). Rho, rhodopsin; FSC, forward scatter. ***, P < 0.001; ****, P < 0.0001; ns, nonsignificant; two-way ANOVA with Bonferroni’s post-test (D), one-way ANOVA with Dunnett’s post-test (E), or unpaired two-tailed Student’s t test (F). Data in B–F are representative of at least two experiments with similar results.

