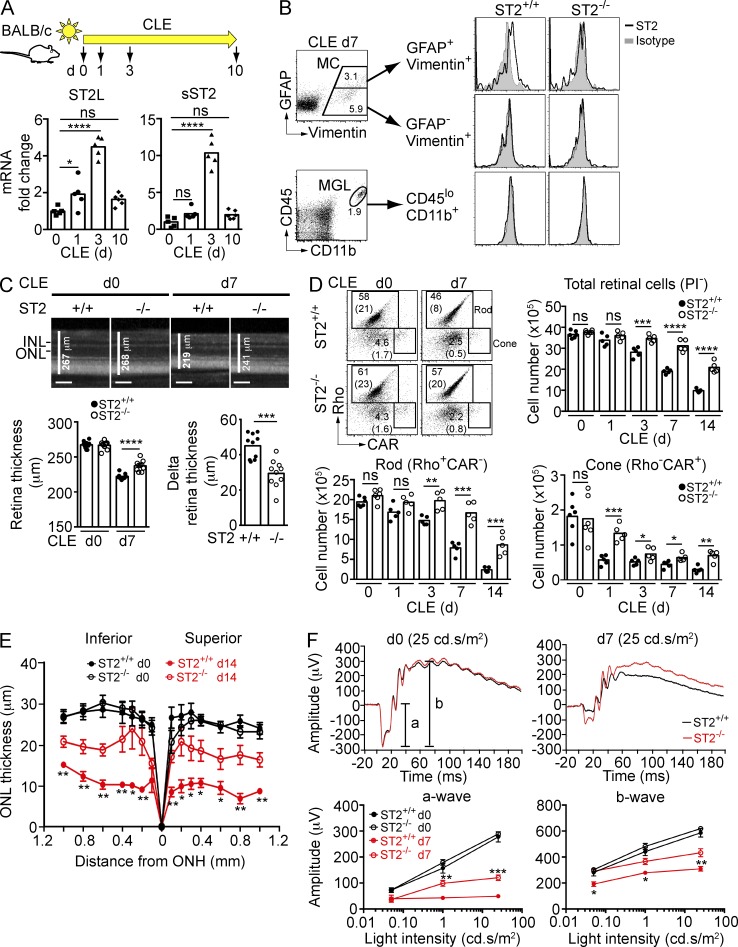
Figure 4.
ST2 is expressed on activated Müller cells after phototoxic stress and blocking ST2 signaling protects photoreceptors. (A) Expression of membrane-bound (ST2L) and soluble (sST2) ST2 following CLE. Retina RNA from BALB/c mice exposed to light for various days was analyzed by qPCR using probes specific for ST2L and sST2, and normalized to 18s rRNA. ST2 expression in nonexposed mice (d0) was set as 1. Each data point represents an individual mouse (n = 5–6/time point). (B) Expression of ST2 on activated (GFAP+vimentin+), resting (GFAP−vimentin+) Müller cells (MC), and microglia (CD45loCD11b+; MGL) after 7 d light exposure. (C) OCT analysis of retina thickness at baseline (d0) and after 7 d exposure to light in ST2+/+ and ST2−/− mice. Delta retina thickness was calculated by subtracting retina thickness of day 0 by that of day 7 for each mouse (n = 10/genotype). Bars, 100 µm. (D) Rods and cones in ST2+/+ and ST2−/− mice were quantified by flow cytometry. FACS plots indicate gating strategy and percentages, as well as absolute numbers (×105; between parentheses) of rods and cones in ST2+/+ and ST2−/− mice. Each data point represents an individual mouse (n = 5–6/group). Rho, rhodopsin; CAR, cone arrestin. (E) Morphometric analysis of ONL thickness of ST2+/+ and ST2−/− mice at baseline (d0) and after 14 d exposure to light plotted as a function of distance from the optic nerve head (ONH). Data shown are means ± SEM (n = 5–7/group). (F) ERG of ST2+/+ and ST2−/− mice at baseline (d0) and after 7 d CLE. (top) Representative ERG recordings at 25 cd/s/m2 light intensity of baseline and after 7 d CLE. Data shown are means ± SEM (n = 10/genotype). *, P < 0.05; **, P < 0.01; ***, P < 0.001; ****, P < 0.0001; ns, nonsignificant; one-way ANOVA with Dunnett’s post-tests (A), two-way ANOVA with Tukey’s post-tests (F), or unpaired two-tailed Student’s t tests (C, D, and E). Data are representative of at least two independent experiments with similar results.

