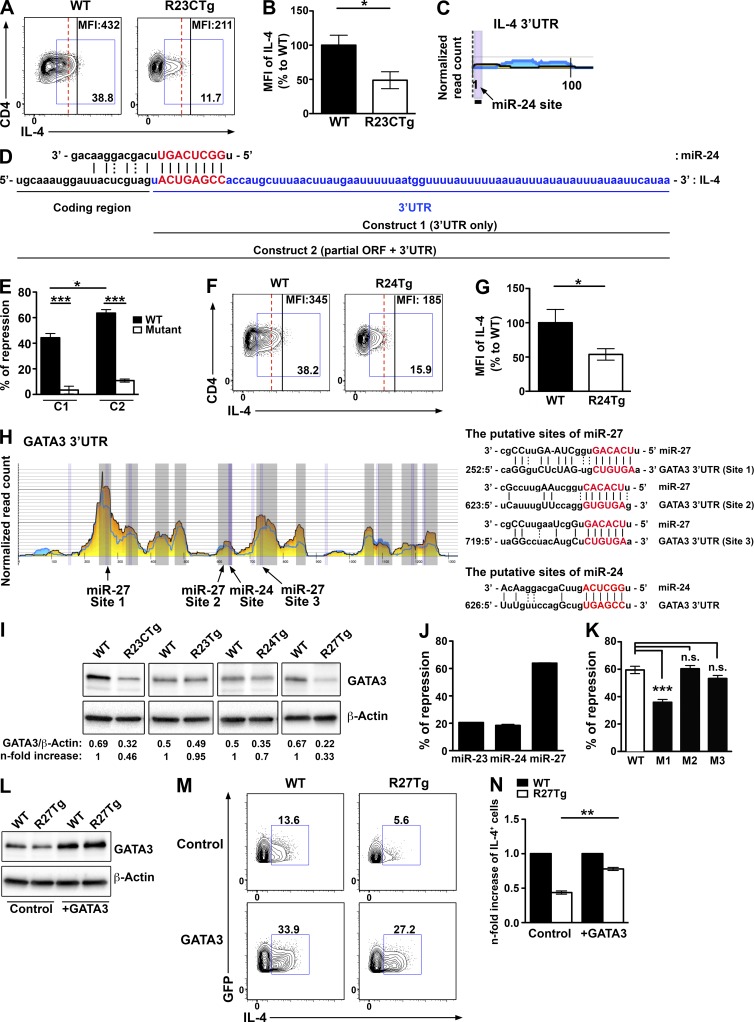
Figure 4.
miR-24 and miR-27 target IL-4 and GATA3, respectively. FACS analysis (A) and ratios of mean fluorescence intensity (MFI; B) of IL-4 from R23CTg CD4+ T cells compared with WT CD4+ T cells under Th2-polarizing condition. HITS-CLIP analysis (C) and sequence alignment (D) of the putative site of miR-24 in IL4. (E) Ratios of repressed luciferase activity of cells with IL-4 3′ UTR only (C1) or 3′ UTR plus partial coding region containing miR-24–interacting sequences (C2) with or without mutations in the seed sequences in the presence of miR-24 compared with cells transfected with empty vector were shown. FACS analysis (F) and ratios (G) of MFI of IL-4 from R24Tg CD4+ T cells compared with WT CD4+ T cells under Th2-polarizing condition. (H) HITS-CLIP analysis and sequence alignment of putative sites of miR-27 and miR-24 in the 3′ UTR of GATA3. (I) Immunoblot analysis of GATA3 expression in T cells cultured for 4 d under Th2-polarizing condition. Densitometric GATA3 expression values were normalized to β-actin expression values and n-fold increase on the basis of each corresponding WT. Ratios of repressed luciferase activity of cells in the presence of WT GATA3 3′ UTR transfected with indicated miRNA (J) or WT or mutated GATA3 3′ UTR with miR-27 compared with cells transfected with empty vector (K). Immunoblot analysis of GATA3 expression (L) and FACS analysis of IL-4 production (M) in GFP+ R27Tg CD4+ T cells transduced with GATA3-expressing or control vector with a GFP reporter under Th2-polarizing condition. (N) n-fold increase (on the basis of corresponding WT controls) of IL-4+ cells in GFP+ R27Tg CD4+ T cells. All data are representative of three independent experiments. n = 3–6. *, P < 0.05; **, P < 0.01; ***, P < 0.001.

